Figure 3.
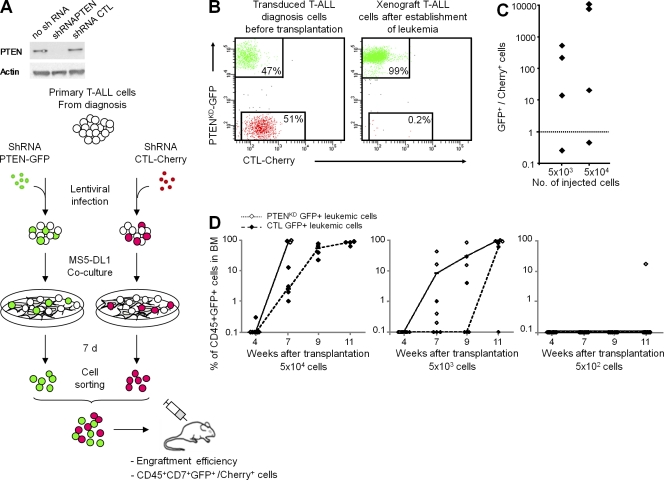
PTEN knockdown confers a selective advantage to diagnosis leukemia cells. (A) Schematic of the protocol for competitive engraftment experiments shown in B and C. Case XLE_61 T-ALL diagnosis cells transduced with control shRNA (shRNA CTL and CTL-Cherry+ cells) and shRNA PTEN (PTENKD-GFP+ cells) lentivectors were sorted and co-transplanted in equal number into NSG mice. Two cell doses (5 × 10⁴ and 5 × 10³ cells per mouse) were tested; three to five mice were injected per cell dose. Immunoblots show PTEN silencing efficiency. (B) Flow cytometry analyses showing the proportion of PTENKD-GFP+ and CTL-Cherry+ cells in leukemia cells immediately before transplantation (left) and in BM cells of a representative mouse after establishment of leukemia (right). (C) PTENKD-GFP+ versus CTL-Cherry+ CD45+ cells ratios are indicated, and each dot represents data of one mouse. The dotted line indicates ratio 1. (D) Kinetics of engraftment of cells transduced with shRNA CTL (CTL-GFP+ cells) and shRNA PTEN (PTENKD-GFP+ cells) lentivectors, injected in parallel (noncompetitive) experiments with decreasing cell doses, as measured by the percentage of CD45+GFP+ cells in BM cells. Each dot represents data of one mouse, dashes represent medians, and lines connect the medians.

