
Figure 6.
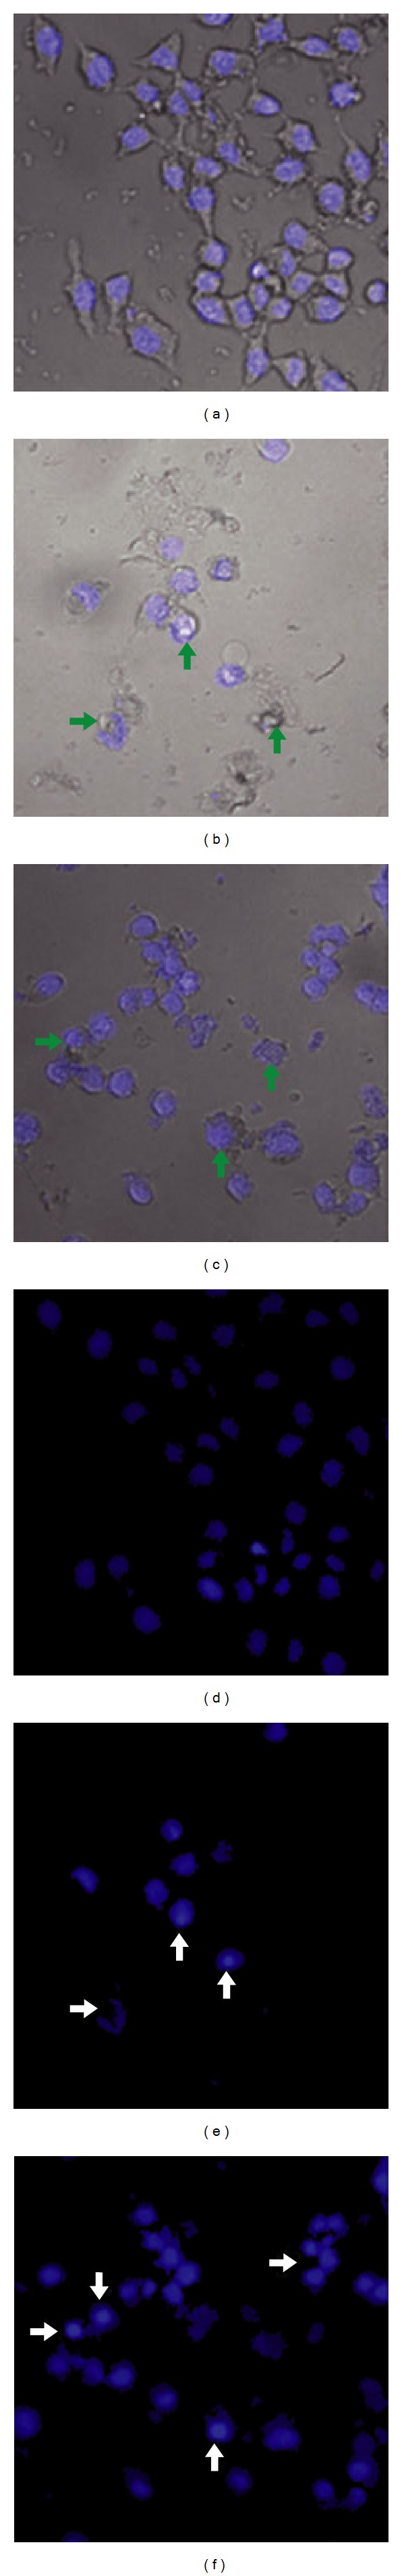
Microscopic analysis of the cytotoxic effects of psoralen and isopsoralen. A group of cells undergoing cell death was examined by fluorescence microscopy after 48 h treatment. After 48 h of exposure, the nucleus of KB cells as well as the cell membrane appears to shrink (green arrows) and the chromatin appears brighter due to condensation (white arrows). Besides membrane blebbing is apparent and the nuclear architecture is rougher in appearance. (a and d): Untreated control KB cells; (b and e): 50 μg mL−1 psoralen-treated KB cells; (c and f): 50 μg mL−1 isopsoralen-treated KB cells.