
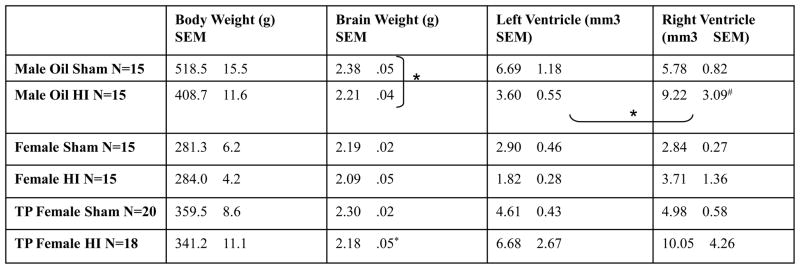
Table 1.
Mean body weight (g) at time of perfusion (~P110) is presented in column 2. Brain weight (g) was taken just after perfusion and is presented in column 3. Significant comparisons (p < .05) between HI and sham counterparts are marked with stars (*). Left and right ventricle size as measured using Cavalieri’s Estimator of volume is presented in column 4 and 5 respectively. Significant comparisons (p < .05) between left and right ventricular volumes are marked with stars (*).
|