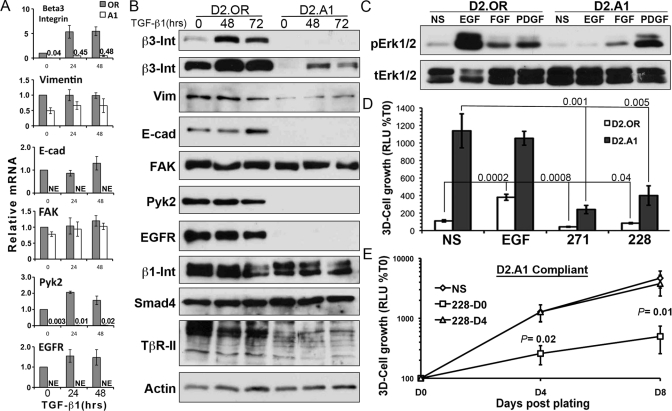
FIGURE 4:
Outgrowth-proficient cells lack E-cad expression. (A) D2.OR and D2.A1 cells were stimulated with TGF-β1 (5 ng/ml) for 048 h and subsequently were analyzed for alterations in the indicated transcripts by RT-PCR. Data are the mean (±SE) of three independent experiments. NE, no expression. (B) D2.OR and D2.A1 cells were stimulated with TGF-β1 for the indicated times and analyzed by immunoblot for the indicated proteins. Data are representative of at least two independent analyses. Int, Integrin; Vim, Vimentin. (C) Quiescent D2.OR and D2.A1 cells were stimulated with the indicated growth factors for 30 min and analyzed for the presence of phospho-ERK1/2 (p-Erk1/2) and total Erk1/2 (t-Erk1/2) as a loading control. Data are representative of three independent experiments. (D) 3D-outgrowth of luminescent D2.OR and D2.A1 cells in the presence of EGF (50 ng/ml) or inhibitors. Data are the mean Day 5 values (±SE) of two independent experiments completed in triplicate. NS, no stimulation; 271, FAK/Pyk2 inhibitor; 228, FAK inhibitor. (E) 3D outgrowth of D2.A1 cells was monitored longitudinally in the absence or presence of the FAK inhibitor, PF228, that was added either at the initiation of the experiment (228-D0) or 4 d after cell plating (228-D4). Data are the mean (±SE) of three independent experiments completed in triplicate.

