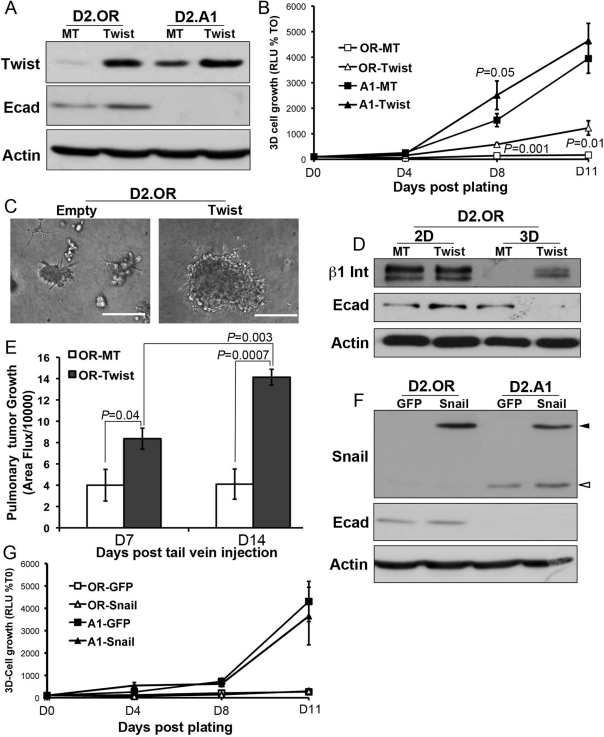
FIGURE 8:
Twist expression is sufficient to initiate pulmonary outgrowth. (A) Immunoblot analysis of Twist and E-cad (Ecad) expression in D2.OR and D2.A1 cells transduced with Twist or empty vector (MT). (B) The 3D outgrowth values of the cells described in (A) were quantified using bioluminescence and are the mean (±SE) of three independent experiments completed in triplicate. (C) Representative photomicrographs (200×) of control (Empty) and Twist-expressing D2.OR cells propagated in 3D cultures. (D) Control (MT) and Twist-expressing D2.OR cells were propagated for 5 d under 2D or 3D culture conditions before analyzing their expression of β1 integrin (β1 Int), E-cad, or actin as a loading control. (E) Control (MT) and Twist-expressing D2.OR cells were injected into the lateral tail vein of BALB/c mice, and pulmonary tumor formation was quantified by bioluminescence. Data are the mean (±SE) area flux values of five mice per group at the indicated time points. (F) Immunoblot analysis showing Snail and E-cad (Ecad) expression in D2.OR and D2.A1 cells stably transfected with GFP-Snail or with GFP as a control. Open arrowhead indicates endogenous Snail; closed arrowhead indicates the GFP-Snail fusion protein. (G) The 3D outgrowth of the cells described in (E) was quantified using bioluminescence assays. Data are the mean (±SD) of triplicate wells from a representative experiment that was performed three times with similar results.

