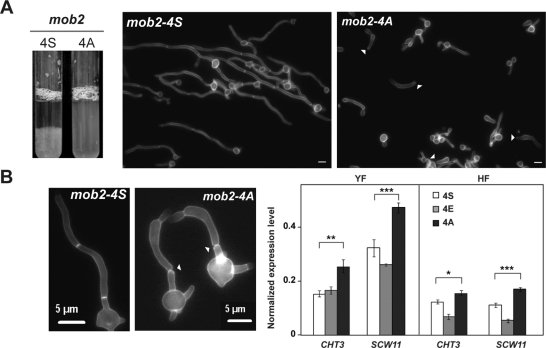
FIGURE 7:
mob24A hyphae activate cell separation. (A) Flocculation of JC613 and JC785 hyphal cultures after 5 h of serum induction. Cells from these cultures were recovered 3 h after induction and stained with calcofluor white (A, B). Arrowheads, separated hyphal compartments. (B) The graph on the right shows the expression of Ace2-target genes CHT3 and SCW11 measured by quantitative RT-PCR in the wild-type, mob24E, and mob24A strains normalized using ADE2. The data are means of two independent experiments, and the error bars indicate standard deviations. The results of pairwise t tests are shown above the brackets: ***p < 0.0001, **p = 0.0005, *p = 0.0054.

