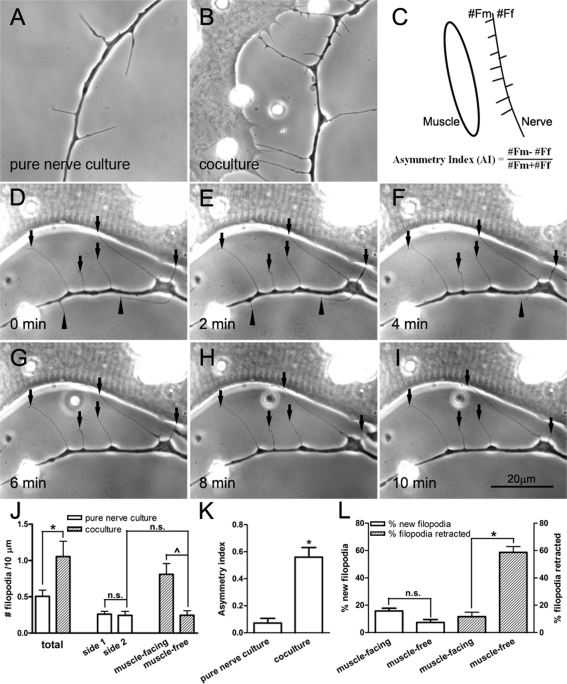
FIGURE 1:
Axonal filopodia generated by Xenopus spinal neurons. In the absence of muscle target, filopodia were generated on either side of the axon with equal frequency (A). However, when a muscle cell was nearby (cell on the left in B), more filopodia were extended toward the target. (C) This difference was quantified by calculating the AI by scoring filopodia from the muscle-facing side (#Fm) vs. those on muscle-free side (#Ff) along axon segments within 30 μm from muscle. (D–I) Time-lapse recording of filopodia near a muscle cell. Muscle-facing filopodia were more stable (pointed out by arrows) than those on the opposite side (arrowheads pointing to filopodia that disappeared with time). (J) Filopodial density determined by scoring them along the length of the axon. The presence of the muscle target caused a large increase in their total density. Most of this increase was seen asymmetrically along the muscle-facing side of the axon. No asymmetry was seen along axons in pure nerve cultures without muscle target. Fifty-three axons from pure nerve culture and 42 axons from nerve–muscle cocultures were counted. (K) AI calculated from axonal segments in pure nerve cultures and nerve–muscle cocultures (22 axons from pure nerve cultures and 26 from nerve–muscle cocultures). The presence of muscle caused highly asymmetric filopodia disposition, with an AI value of 0.56 ± 0.07. (L) The formation (open bars) and retraction (hatched bars) of axonal filopodia in cocultures. On the muscle-facing side of the axon, more new filopodia were formed than on the muscle-free side. However, the major difference was seen in the stability of filopodia on the muscle-facing side. This is shown by the much lower rate of retraction during a 10-min period. Nineteen nerve–muscle cocultures were scored. In J–L, the mean ± SEM in each case is plotted, *p < 0.05 (Student's t test).

