FIGURE 6:
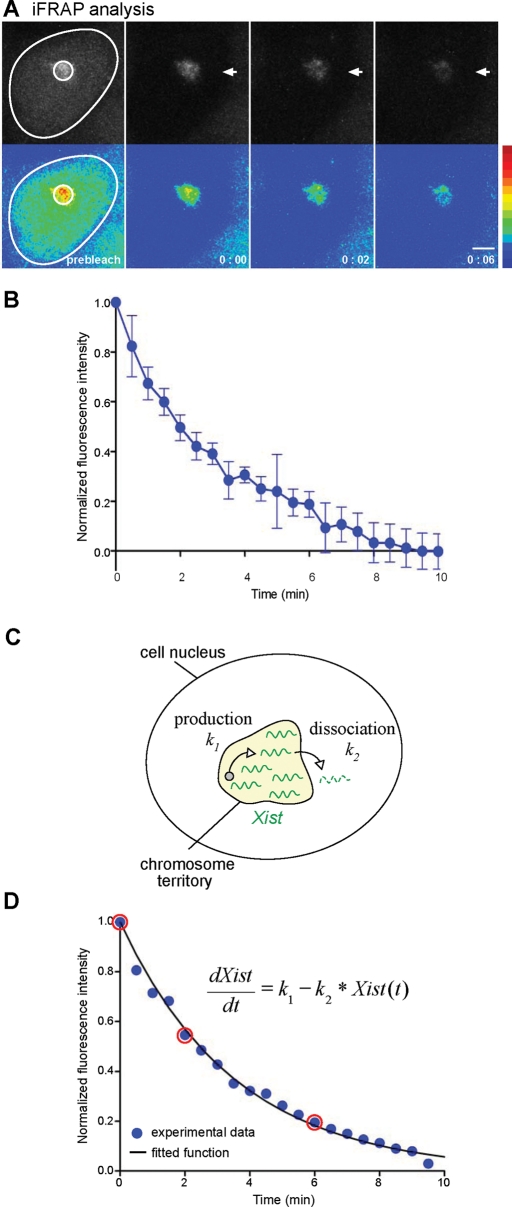
Displacement of chromosome-bound Xist. (A) iFRAP analysis of Xist turnover in XMG ES cells. A confocal image series is shown in gray scale (top) and in pseudocolor (bottom). The nuclear pool of MCP-GFP outside the Xist territory was photobleached (white outline). Scale bar, 2 μm. (B) The normalized signal intensity of the iFRAP experiment of the Xist cluster is plotted over time (n = 4). Error bars represent SD. (C) Xist turnover is characterized by its production with rate k1 from the site of transcription and loss due to dissociation off the chromosome with the dissociation constant k2. After dissociation Xist is degraded. In steady state the Xist cluster is stable, and production and dissociation balance. (D) The normalized signal intensity of the single experiment shown in A is plotted over time. Red open circles indicate data points of the images in A. The data points were fitted to a kinetic model of Xist transcription and dissociation (black line).

