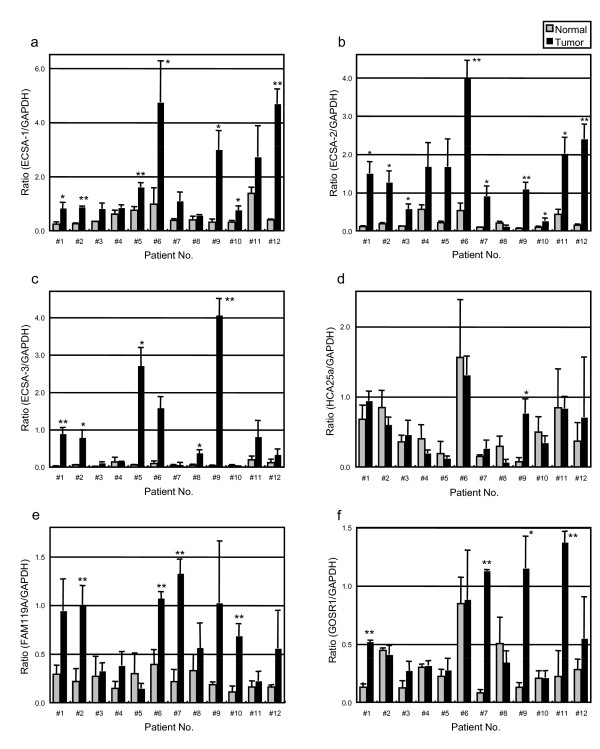
Figure 7.
Expression of ECSA family mRNAs in normal and esophageal SCC tissues. The expressions of ECSA-1 (a), ECSA-2 (b), ECSA-3 (c), HCA25a (d), FAM119A (e) and GOSR1 (f) mRNA were examined by RT-PCR in specimens of normal and esophageal SCC tissues resected from patients 1 to 12 (#1 - #12). Each value was normalized with that of GAPDH, and the averages of three experiments are shown. The error bars represent SD (n = 3, t test). Asterisks indicate a significant increase in carcinoma tissues as compared to normal tissues. (*, p < 0.05; **, p < 0.01).

