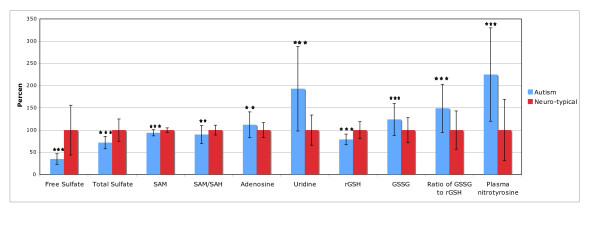
Figure 3.
Sulfation, methylation, glutathione, and oxidative stress biomarkers which were significantly different between the autism and neurotypical groups, rescaled to the average neurotypical values. The average values and the standard deviations are shown. The number of asterisks indicates the p-value (* p < 0.05, ** p < 0.01, *** p < 0.001).

