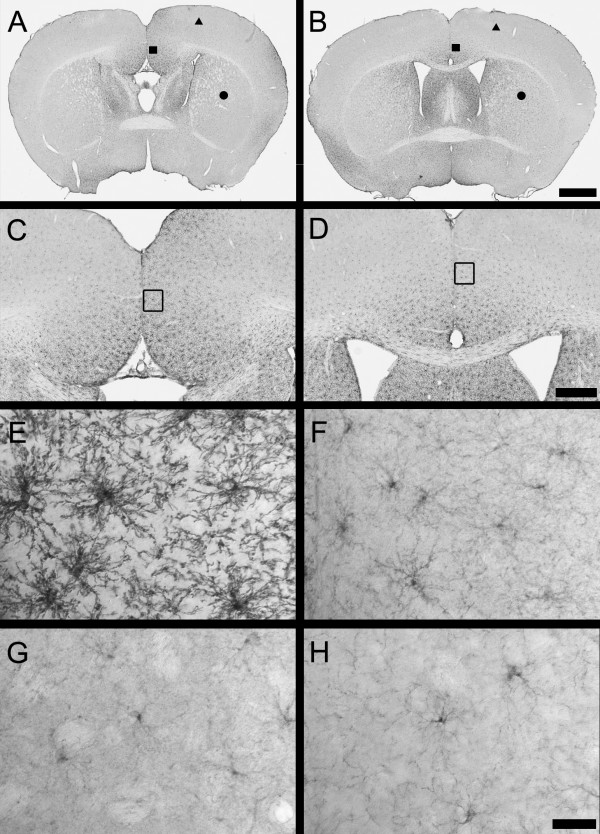
Figure 5.
Oligodendrocyte precursors defined by neuroglial proteoglycan NG2 immunoreactivity are qualitatively increased in the anterior cingulate cortex of the BTBR mouse. Immunoperoxidase localization of NG2 in the forebrain of representative (A, C, E, G) BTBR and (B, D, F, H) B6 mice, at (A, B) low, (C, D) medium and (E, F, G, H) high magnifications. (B) Prominent cellular immunoreactivity of NG2 was visible throughout the brain of B6 mice with variation in expression levels in different brain regions. For example, constitutive levels of NG2 immunoreactivity in B6 mouse brain were higher in the septum and anterior cingulate cortex (square) than in the isocortex (triangle) or striatum (circle). (C, D) Increased magnification of (A, B) in the midline cortical region, illustrating NG2 immunoreactivity. (E, F) High-magnification illustration of increased NG2 staining in the ACC of the BTBR compared with the B6 mouse (from square region in (A, B) and open rectangle in (C, D), respectively). (G, H) High magnificationof NG2 staining in the BTBR and B6 mouse striatum, showing no qualitative difference in NG2 immunoreactivity (from circle region in (A, B)). Scale bars = (A, B) 1000 μm, (C, D) 500 μm, (E, F, G, H) 25 μm.

