Figure 7.
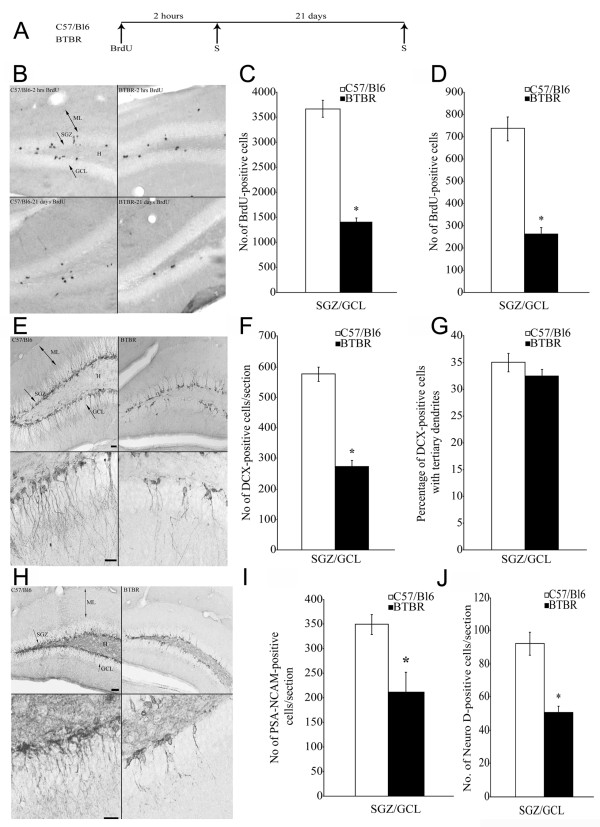
Regulation of adult hippocampal neurogenesis in BTBR mice. (A) Schematic representation of the experimental design to assess the regulation of adult hippocampal neurogenesis in BTBR mice (S time point represents time of euthanasia). Proliferation phase was assessed at 2 hours, and survival of neural precursors was examined at 21 days post bromodeoxyuridine (BrdU) administration. (B) Representative photomicrographs of BrdU-positive cells in the subgranular zone (SGZ)/granule-cell layer (GCL) of the B6 and BTBR animals. BrdU-positive cells were seen in the SGZ at the border of the GCL and hilus. (C) Quantitative unbiased stereological analysis revealed a significant decrease in the number of BrdU positive cells in the SGZ/GCL in the BTBR mice in the proliferation study. (D) Quantitative stereological analysis revealed a significant decrease in the BrdU-positive cells in the SGZ/GCL of the BTBR mice in the survival study. (E) Representative photomicrographs of DCX positive cells in the SGZ of the B6 and BTBR hippocampus, and the corresponding magnified image of the DCX positive cells with tertiary dendrites. (F) Analysis of DCX-positive cells per section in the SGZ/GCL region revealed a significant decrease in the BTBR animals compared with the B6. (G) Percentage of DCX positive cells with tertiary dendrites did not find any significant change between the B6 and BTBR animals. (H) Representative photomicrographs of cells positive for PSA-NCAM from B6 and BTBR animals, and the corresponding magnified images are shown. (I) Quantitative analysis of the PSA-NCAM positive cells in the BTBR compared with the B6 animals revealed a decreased number of PSA-NCAM positive cells per section in the BTBR animals. (J) Quantitative analysis revealed a significant decrease in the number of NeuroD positive cells per section in the SGZ/GCL of the BTBR compared with B6 animals. The results are expressed as mean ± SEM (n = 9/group). *P < 0.05 compared with the B6 animals (Student t-test). (E, H) Scale bars = 50 μm (top panel), 25 μm (bottom panel). H = hilus, ML = molecular layer.

