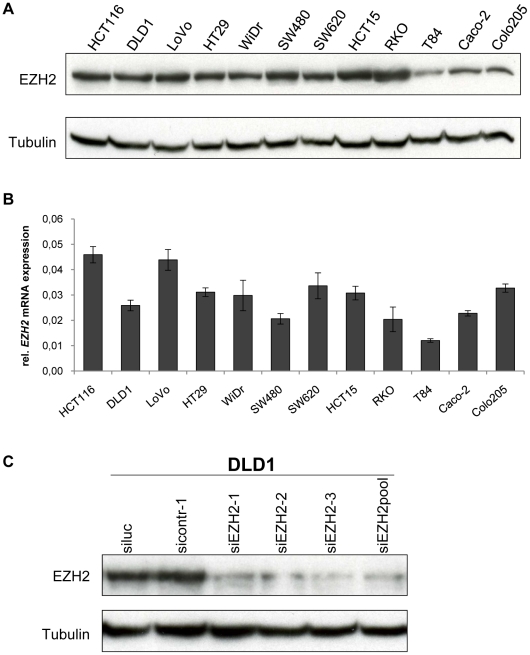
Figure 1. EZH2 expression in colon cancer cell lines.
A Immunoblot analysis of EZH2 protein expression. Tubulin, loading control. B qRT-PCR analyses of EZH2 mRNA expression. Data are presented as fold differences in gene expression, normalized to a housekeeping gene index. Standard deviations from two reverse transcription replicates are indicated. C Modulation of EZH2 protein expression by RNAi. EZH2 expression was determined by immunoblot analysis 48 hours after transfection with EZH2-targeting siRNAs or control siRNAs, as indicated. siEZH2pool: pooled EZH2-targeting siRNAs. Tubulin, loading control.

