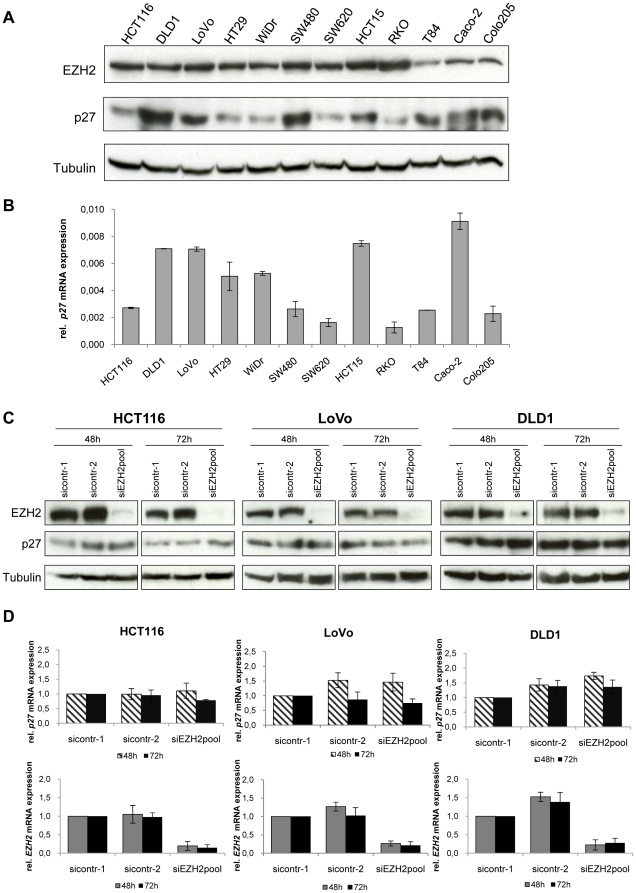
Figure 6. Relation between EZH2 and p27 expression in vitro.
A EZH2 and p27 protein expression in colon cancer cell lines, assessed by immunoblot analyses. Tubulin, loading control. B p27 mRNA expression, measured by qRT-PCR analyses. Data are presented as the fold differences in gene expression, normalized to a housekeeping gene index. Standard deviations from two reverse transcription replicates are indicated. C Immunoblot analyses after EZH2 depletion by RNAi. EZH2 and p27 levels are indicated. Tubulin, loading control. D qRT-PCR analyses after EZH2 depletion by RNAi. p27 and EZH2 mRNA levels are indicated relative to sicontr-1-treated cells (arbitrarily set at 1.0). Standard deviations of three independent experiments are indicated.

