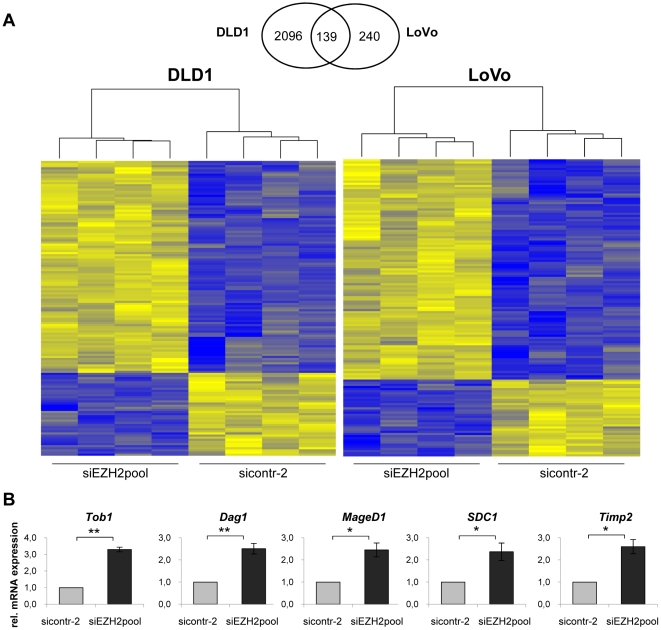
Figure 7. Altered gene expression in colon cancer cell lines upon EZH2 depletion.
A Venn-Diagram and heatmaps of 139 genes that were significantly affected at the transcript level by EZH2 depletion in both LoVo and DLD1 cells. Heatmaps were generated using hierarchical clustering. Cells were either treated with siEZH2pool or sicontr-2. Four biological replicates were analyzed for each sample. Significantly upregulated genes are indicated in yellow, significantly downregulated genes in blue. B qRT-PCR analyses to assess the expression of five genes that were affected by EZH2 depletion in the transcriptome analysis (see above). Indicated are the results from three independent experiments conducted in DLD1 cells. mRNA levels are shown relative to sicontr-2-treated cells (arbitrarily set at 1.0). Standard deviations are indicated. Asterisks equal p≤0.05, double asterisks equal p≤0.01.

