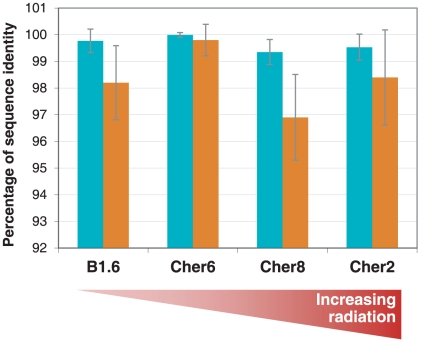
Figure 7. Percentage of sequence identity at SSU rRNA genes and adjacent ITS regions in the same Rubrobacter OTU from different populations.
Note that the scale at the ordinates begins at 92% to maximize potential differences between samples and markers. The bars correspond to the standard deviation.

