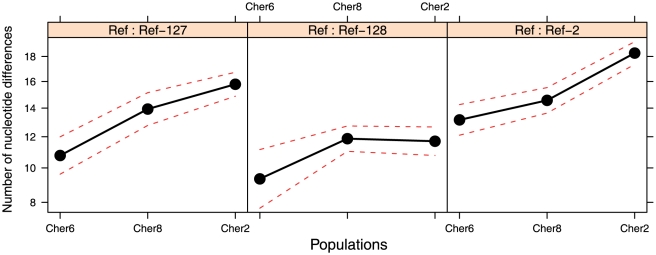
Figure 9. Adjusted means by population of the number of differing nucleotides as compared to the control Northern Ireland sequences (Ref-127, Ref-128, Ref-2 from left to right).
The Y-axis represents the number of expected differences when assuming a similar level of SSU rRNA variation set to the general mean (i.e. ca. 13 differing nucleotides).

