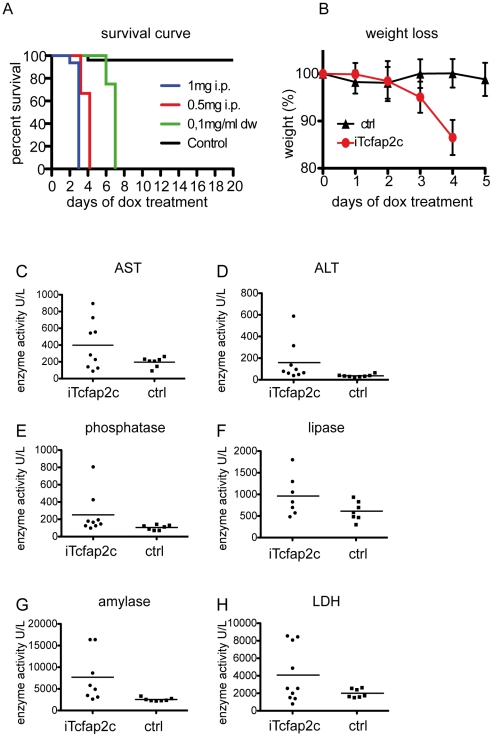
Figure 2. iTcfap2c-mice show strong morbidity in a dox-dependent manner.
(A) Kaplan-Meier plot showing survival after dox treatment. Green line: iTcfap2c-mice receiving dox via drinking water (dw) (0.1 mg/ml, n = 6). Blue and red line: iTcfap2c-mice receiving dox via intra peritoneal injection (i.p.) (blue: 1 mg/day, n = 33), (red: 0.5 mg/day n = 12). Black line: control mice (0.1 mg/ml dox by in dw for 20 days). (B) Weight of iTcfap2c (red) and ctrl animals (black), which received 0.5 mg dox i.p. per day (n = 12). (C–H) Biochemical blood serum analysis. Enzyme activity was measured as the concentration of substrate converted per minute (1 enzyme unit = 1 µmol substrate/min) in units/ liter. iTcfap2c (n = 9) and ctrl animals (n = 7) were induced with 1 mg/ml dox per day. Blood samples were collected the third day.

