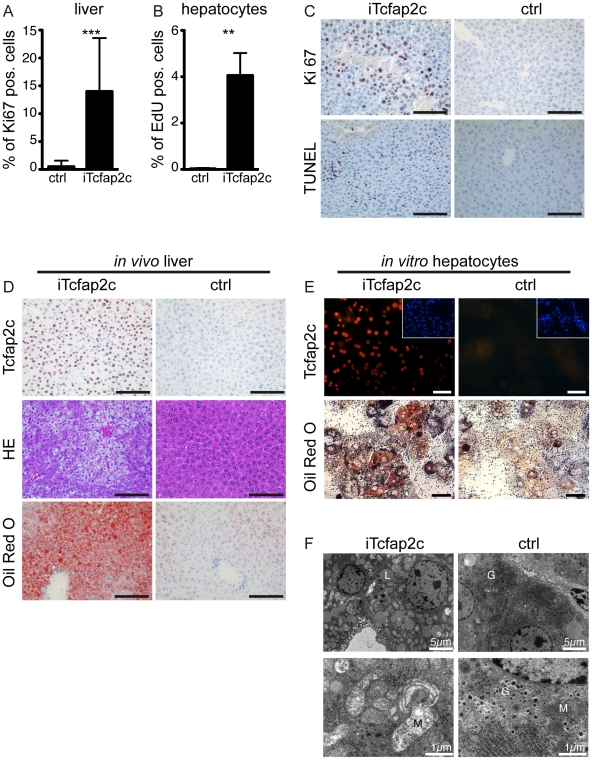
Figure 3. Tcfap2c increases proliferation and induces hepatic steatosis.
(A) Percentage of proliferating Ki67 positive hepatocytes in iTcfap2c (n = 5) and ctrl mice (n = 4) (B) Percentage of proliferating hepatocytes in cell culture, as the number of EdU positive cells. Error bars represent standard deviations. ***p≤0.0001, **p≤0.001 (C) Immunohistochemical staining of liver for Ki67 (proliferation, upper panel) and TUNEL staining positive (apoptosis, lower panel). (D) HE (middle panel) and Oil Red-O (lower panel) staining showing fat accumulation and microvisicular steatosis. (E) Tcfap2c immunohistochemistry (upper panel) and Oil-Red O staining (lower panel) of primary hepatocytes. (F) Transmission electron microscope images of iTcfap2c and ctrl liver. Hepatocytes from iTcfap2c mice are filled with lipid droplets (L); Dark and dense mitochondria in ctrl cells but bright mitochondria in iTcfap2c cells were evidence for mitochondria damage. Glycogen granules (G) were visible only in ctrl cells. Scale bars = 100 µm.

