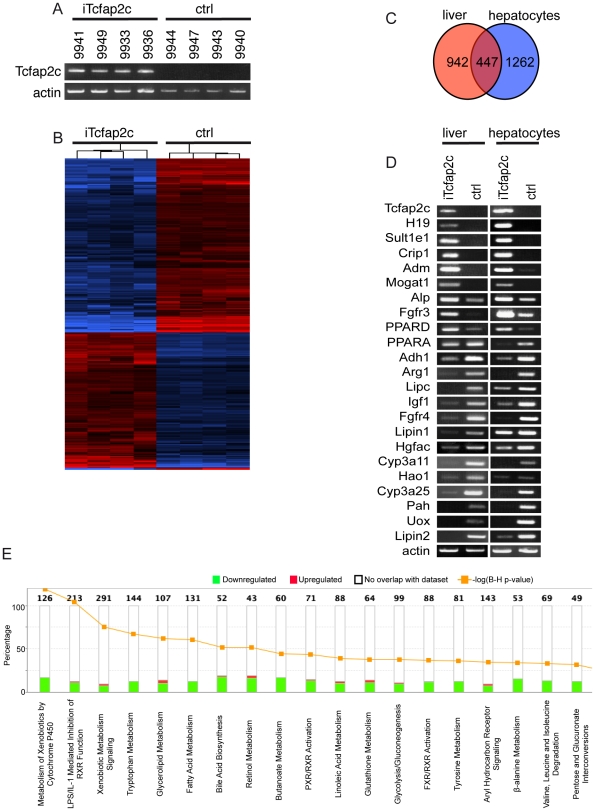
Figure 4. Genes regulated by Tcfap2c and deregulated pathways.
(A) Affymetrix microarray gene expression analysis performed with RNA extracted from livers of iTcfap2c (n = 4) and ctrl (n = 4) mice. (B) Heat map showing genes with at least twofold difference between any pair of samples from different classes. Red and blue indicate higher and lower relative expression, respectively. (C) Venn diagram; commonly regulated transcripts by Tcfap2c in vivo and in vitro are shown in the intersection part. (D) RT-PCR of RNA isolated from iTcfap2c and control liver (left column) and Hepatocytes (right colum using the genes indicated (E) Top 18 most significantly regulated pathways are presented based on common gene lists regulated by Tcfap2c.

