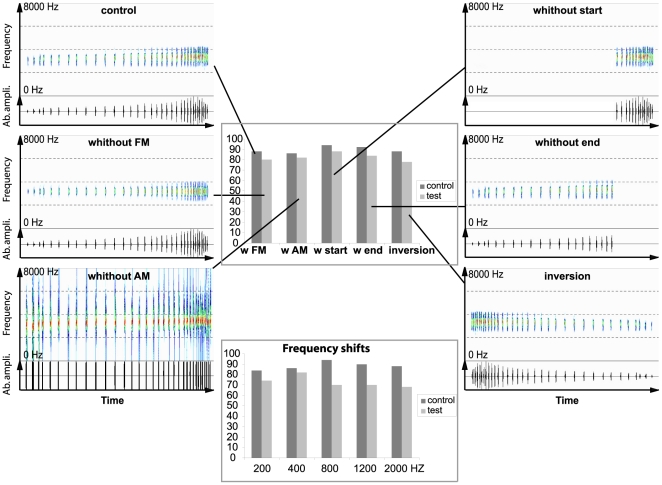
Figure 6. Sonographic and oscillographic representations of test signals used for playback experiments (signals corresponding to tests of frequency parameters are not shown).
Histogram representations correspond to the associated responses expressed as a proportion of the theoretically maximal response score.

