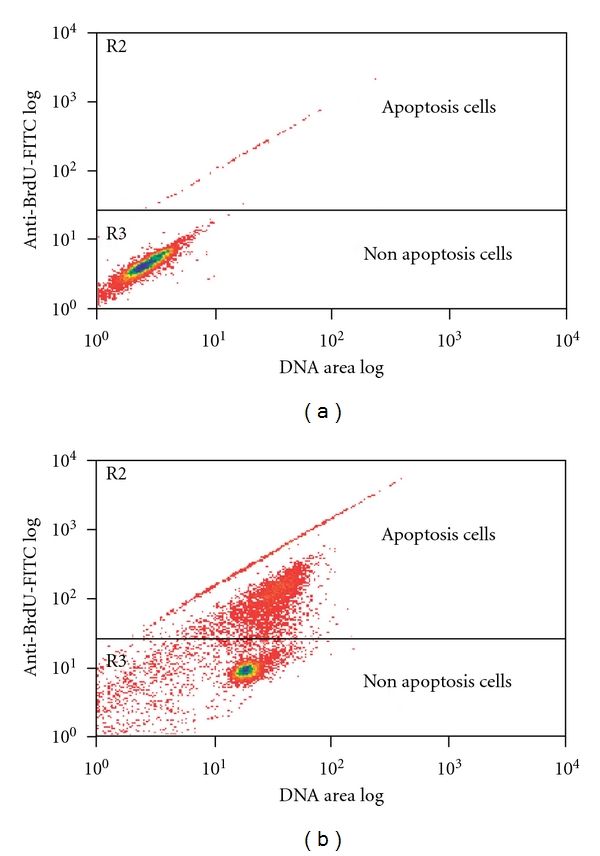
Figure 7.

Apo Brdu-TUNEL assay showing the effect of 48 h exposure of CEMss to 3 μg/ml DCM/F7. The x-axis of the density plots shows relative DNA content, while y-axis shows the relative number of strand break within individual cells. (a) Control 48 h (n = 2) and (a) CEMss cells exposed to 3 μg/ml DCM/F7 (n = 2 for each experiments).
