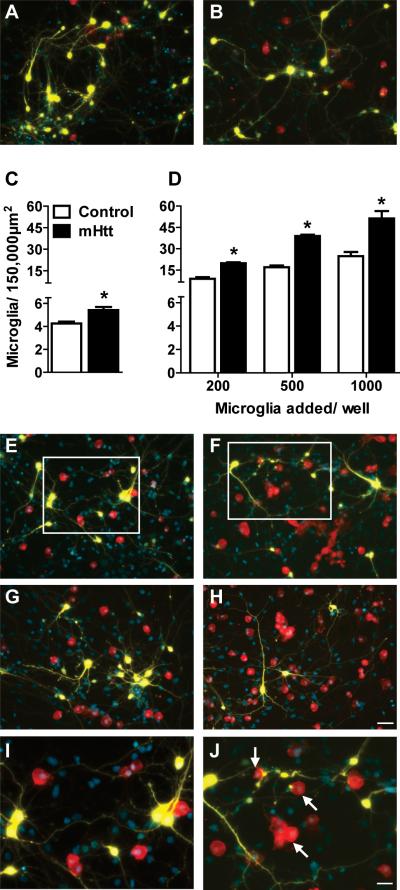
Figure 1. An elevated number of microglia are present after culture with mHtt-expressing neurons.
(A-B) Staining for microglia (Iba1, red) around striatal neurons (yellow, DAPI nuclear counterstain in blue) transfected with control DNA (A) or mHtt DNA (B) in composite cortico-striatal cultures. (C) Iba1 cell counts seven days after transfection with control or mHtt DNA (*p<0.05). (D) Exogenous microglia were added to the composite cultures on the same day as transfection with control or mHtt DNA and microglia counted at 7DIV (*p<0.05). (E-J) Microglial staining around striatal neurons transfected with control DNA (E,G, and I) or mHtt DNA (F,H, and J) and cultured with varying concentrations of exogenously-added microglia: 500 in E-F and 1000 in G-H (scale= 50μm). I and J: higher magnification images of boxes inset in E and F, respectively, to show microglial interactions at neurites and mHtt+ neuronal blebs (arrows; scale= 25μm). Small, YFP-negative, DAPI-positive nuclei are co-cultured cortical neurons and non-transfected striatal neurons. Composite images of the individual fluorochromes (YFP, Iba1, CFP, and DAPI) for E-H are shown in Supplementary Fig. 2.

