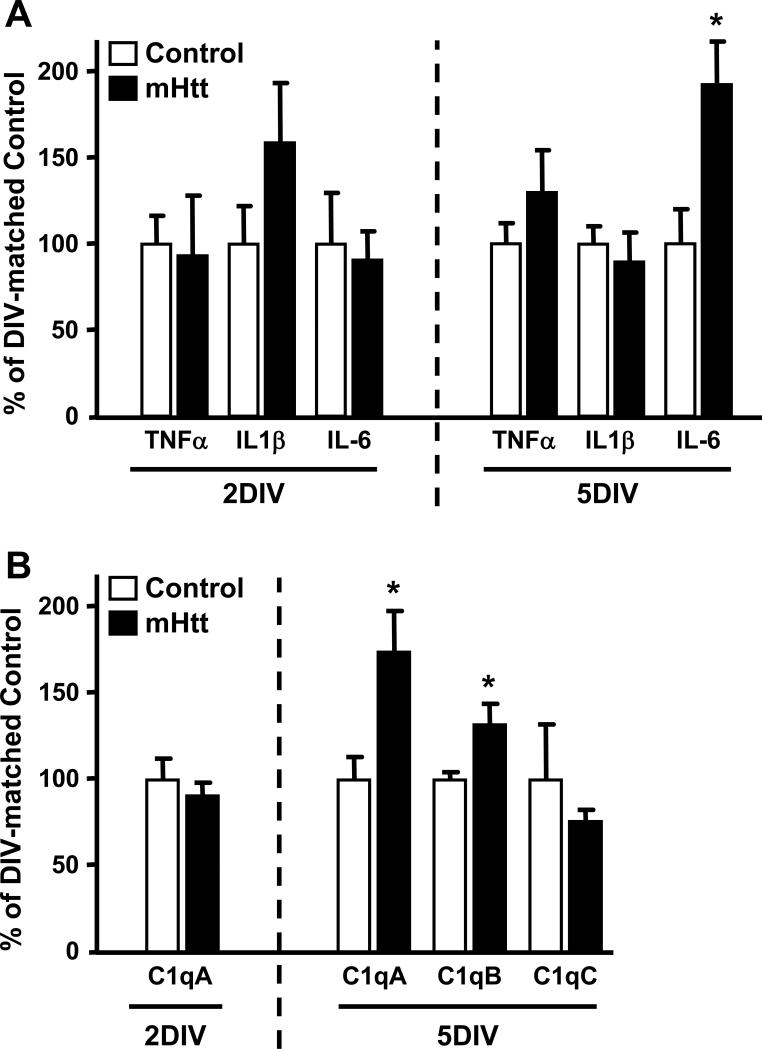
Figure 11. Neuronal mHtt expression reconfigures the molecular profile of striatal slices, resulting in increased IL-6 and C1q expression.
(A) qPCR for select cytokines in the striatum of 2DIV and 5DIV cultures transfected with control or mHtt DNA. (B) qPCR for complement component 1q (C1q) components at 2DIV and 5DIV. Values are corrected to Rpl32 housekeeping gene expression and displayed according to their % change from DIV-matched control cultures (n=3 independent pools of 5 slices from an individual animal; *p<0.05).

