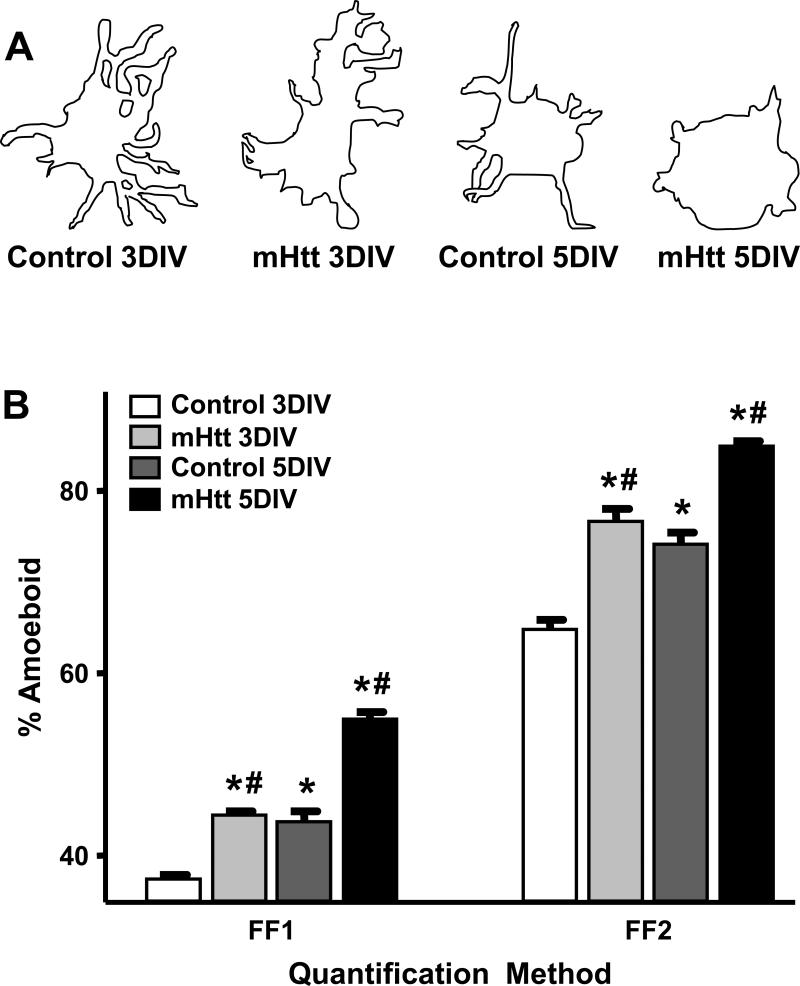
Figure 9. Microglia assume a more amoeboid phenotype when surrounding striatal neurons expressing mhtt fragments than when surrounding control neurons.
(A) Camera lucida drawings of microglia representing the median morphology of microglia quantified within a 100μm radius of striatal neurons transfected with control or mHtt plasmids at 3 and 5DIV. (B) Quantification of microglia morphology (within a 100μm radius of transfected neurons) by the FF1 or FF2 method at 3 and 5DIV around control or mHtt-expressing neurons (*p<0.05 from microglia in 3DIV control cultures; #p<0.05 from DIV-matched controls; at 3 and 5DIV, respectively: 187 and 440 microglia were evaluated in control cultures and 338 and 331 microglia in mHtt- transfected cultures).

