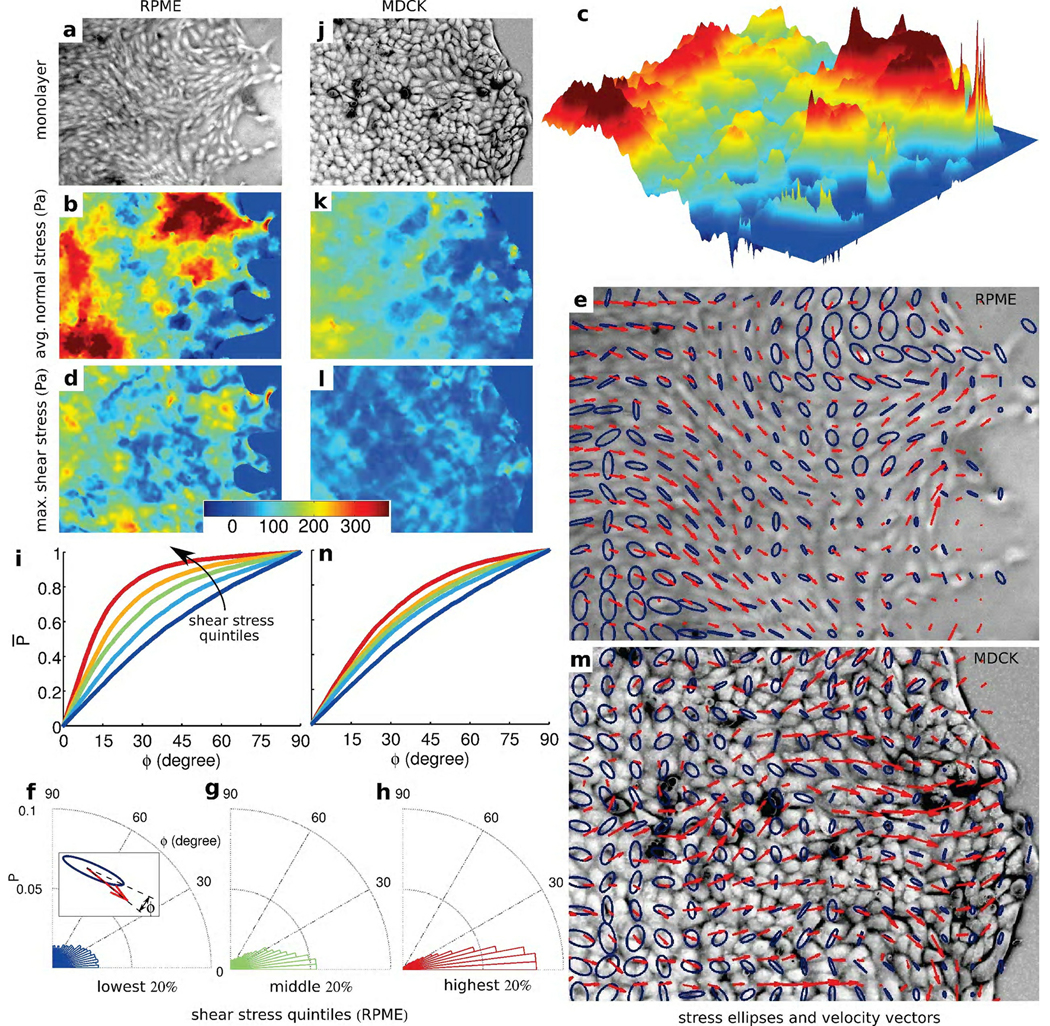
Figure 2. Intercellular stress maps and mechanical guidance of collectively migrating monolayers.
(a) Transmitted light image of rat pulmonary microvascular endothelial (RPME) cell monolayer. Corresponding to this image are the maps of average normal stress (b), which is predominately tensile but forms a rugged stress landscape (c), the maximum shear stress (d), principal stress ellipses (blue) and cell velocity vectors (red) (e). The alignment angle, ϕ, between major axis of the principal stress ellipse and direction of the cellular motion (f, inset) shows that the greater the local shear stress the narrower is the distribution of ϕ (f, g, h). The cumulative probability distribution P̅ (ϕ) varied strongly and systematically with stress anisotropy (i); curves from blue, to red are in the order of higher quintiles. Comparable maps are found for the Madin-Darby canine kidney (MDCK) cell monolayer (j–n). Note that the average tensile stress (k) increased systematically with increasing distance from the advancing front thus contributing to the state of global tug-of-war15. Vertical size of the images of cell monolayer: RPME − 545 µm, MDCK − 410 µm. Each curve in (i) and (n) and distributions in (f), (g), and (h) have more than 8,000 observations.

