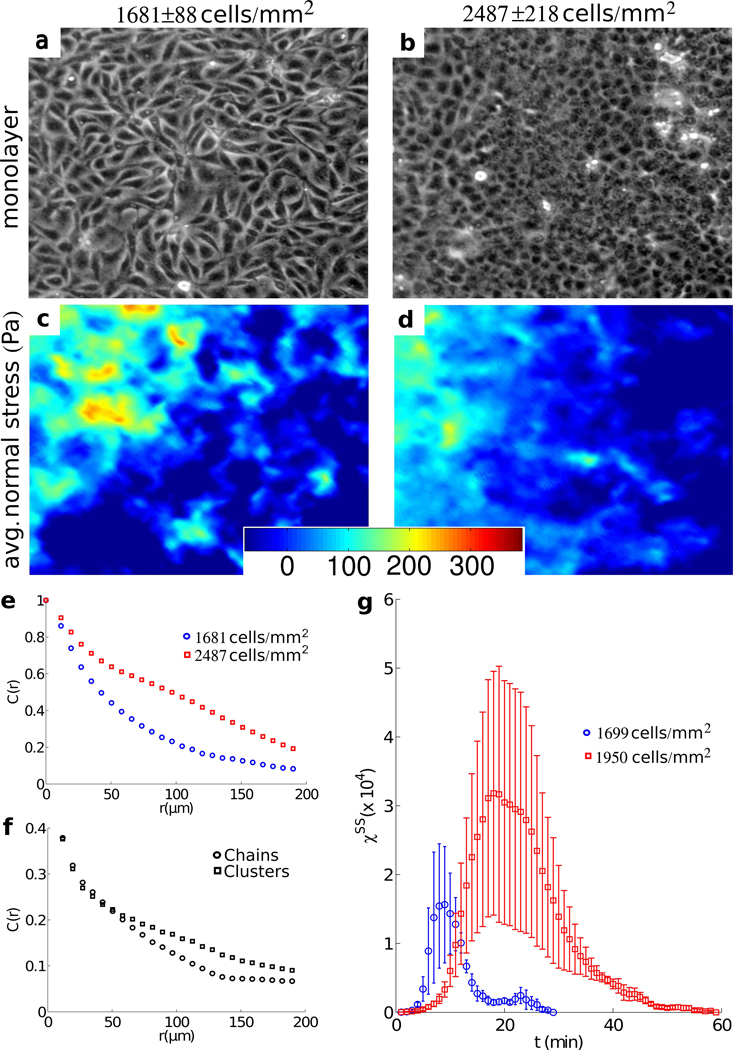
Figure 5. Signatures of cooperativity and associated glassy dynamics.
Phase contrast images of a monolayer of Madin-Darby canine kidney (MDCK) cells well away from the leading edge at early (a, t=196 min, density=1681±88 cells/mm2) and late (b, t=3196 minutes, density=2487±218 cells/mm2) times. Also shown are corresponding maps of average normal stress (c, d). Note that any contribution to the stress field with a wavelength longer than the size of the field of view is not included in the calculation. Thus a stress build up extending over the entire monolayer as previously reported15 is absent from this analysis. (e) Time averaged spatial autocorrelation function, C(r), of average normal stress in low density (1681 cells/mm2, blue), and high density (2487 cells/mm2, red) regions. (f) C(r) of high density maximal principal stress resolved into components representing force chains (circles) and force clusters (squares). (g) Variance, χss, of the self-overlap parameter, qs, as a function of time, in early, low denisty (t=1–270 minutes, 1699 ±40 cells/mm2, blue) and late, high density (t= 1800–2070 minutes, 1950±156 cells/mm2, red) intervals. Each curve represents an average over three successive 90 minute windows of similar density. Error bars represent the standard deviation over the square root of the number of windows. Vertical size of the images of monolayer: 480 µm.

