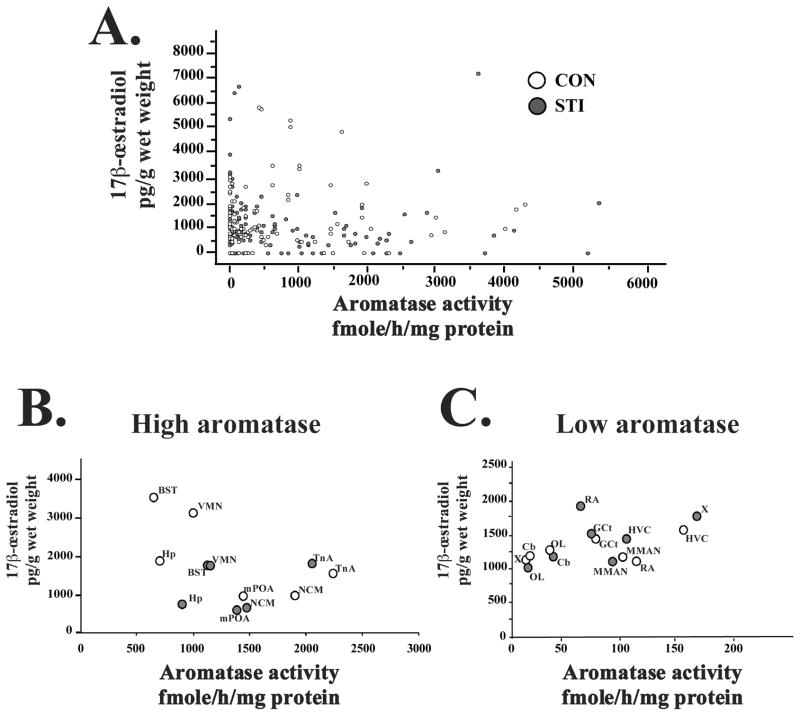
Figure 4.
Graphs showing the absence of correlations between brain aromatase activity (fmoles/h/mg of protein) and brain 17β-œstradiol concentration (pg/g of wet weight) in CON (empty circles) and STI (grey circles) animals. (A) Graph that includes all data from all subjects. (B and C) Aromatase activity (group average) as a function of œstradiol concentration (group average) for high aromatase and low aromatase regions in CON (empty circles) and STI (grey circles) subjects.

