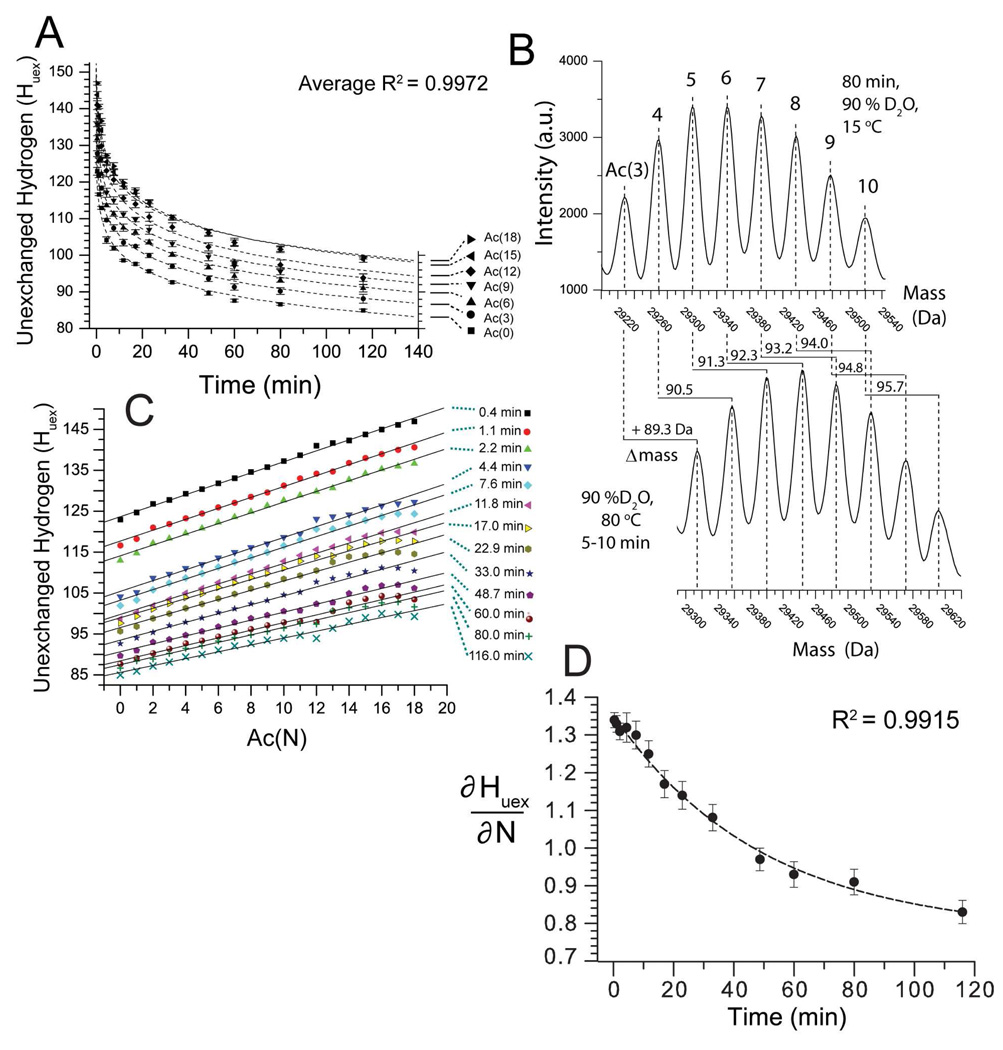
Figure 4. Lysine acetylation decreases the rate of H/D exchange of BCA II as measured by ESI-MS.
A) H/D exchange kinetics of the BCA II charge ladder (90 % D2O, pD 7.4, 15 °C). For clarity only BCA-Ac(0), (3), (6), (9), (12), (15) and (18) are shown. BCA-Ac(0) retained ~85 unexchanged hydrogens after 100 minutes in D2O. The higher rungs are more protected from H/D exchange than the lower rungs. BCA-Ac(3) retained ~ 87 unexchanged hydrogens after 100 minutes; BCA-Ac(6), 90; BCA-Ac(9), 93 and BCA-Ac(12), 97. The last four rungs, BCA-Ac(15) through BCA-Ac(18) have nearly superimposable exchange profiles and retain ~ 100 unexchanged hydrogens after 100 min. Error bars represent the standard deviation of average mass values calculated from seven charge states for each rung. B) Mass reconstruct showing BCA-Ac(3) through BCA-Ac(10) after 80 minutes in 90% D2O, pD 7.4, 15 °C (top) and after the same sample is heated and the proteins are unfolded (bottom). Each higher rung incorporates (after 80 minutes) approximately one additional deuteron upon thermal unfolding as observed by an increase of 0.8–1.0 Da in the mass for each rung. C) Plot of number of unexchanged hydrogen (Huex) for each rung of the charge ladder (N) after various periods of time in D2O, ranging from 0.4 min to 116 min (e.g., ∂Huex/∂N). D) The slope of each line in Figure 4C (denoted ∂Huex/∂N) is plotted as a function of time (t) and fit with the single exponential function y = yo + Ae-kx. The ∂Huex/∂N value is decreasing exponentially with time with a half life t1/2= 34.1 min. The quantity ∂2Huex/∂N∂t expresses the magnitude by which the acetylation of lys-ε-NH3+reduces the aggregate rate of H/D exchange in BCA II. The error bars represent the standard deviation that was calculated from the linear fit of each data set in Figure 4C.

