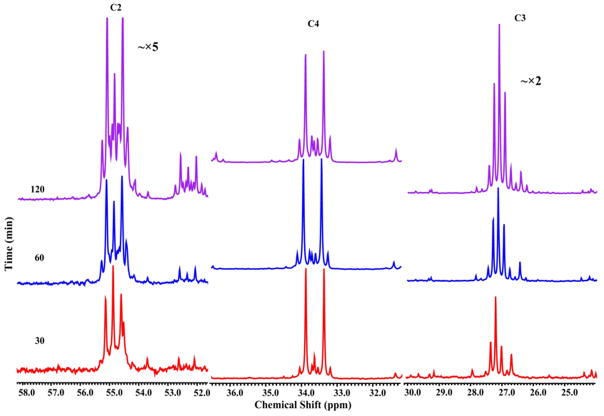
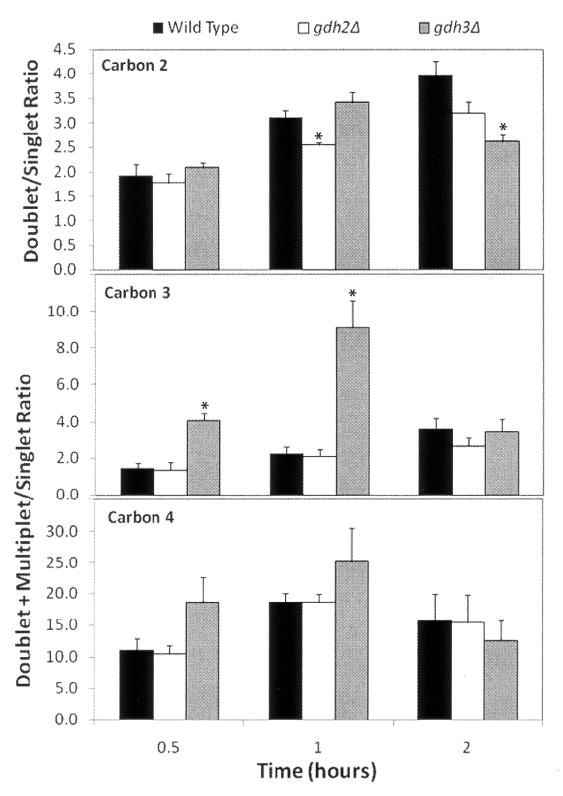
Figure 4.
Analysis of glutamate carbon 13C signal complexity as a function of time in [1,2-13C]-acetate. (A) Example of expanded spectra for carbons 2, 4, and 3 (C2, C4, and C3) from the gdh2Δ strain at 30, 60 and 120 minutes. (B) Intensity of multiplet resonances (d, t, dd) as compared to the singlet peak as a function of time. The intensities of multiplet and singlet peaks from three separate experiments were integrated and calculated as a ratio of multiplet to singlet +/− SEM. Data for carbons 1 and 5 are not included, since the intensity was weak and primarily multiplet (data not shown). *, p < 0.05 as compared to the other two strains for this carbon at the same time point.


