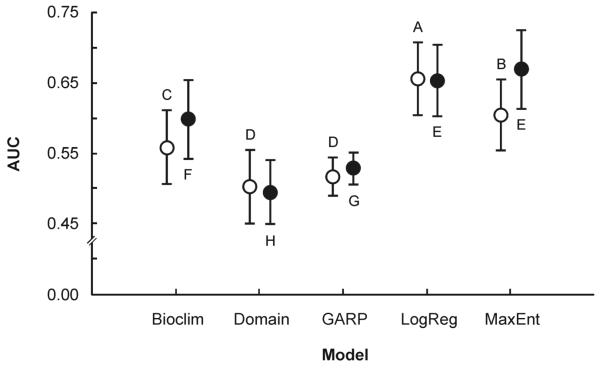
Fig. 1.
Performance (AUC) of the five algorithms evaluated (MaxEnt, logistic regression, GARP, Domain, and Bioclim) with the two different datasets based on the 30 training-testing subsamples. Circles indicate mean values and error bars one standard deviation. Open markers represent 2006 and filled ones 2007 values. Markers not connected by same letter are significantly different (Tukey-Kramer HSD test, α=0.05).

