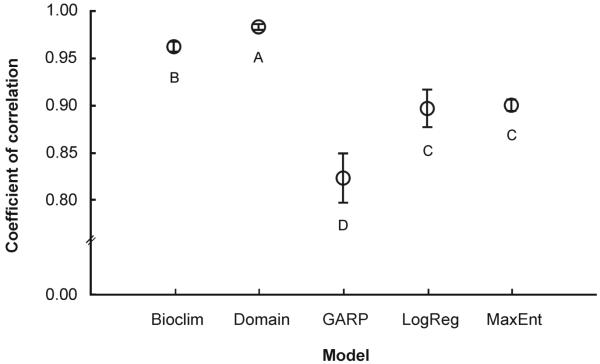
Fig. 3.
Coefficients of correlation between the risk classifications of the five algorithms evaluated (MaxEnt, logistic regression, GARP, Domain, and Bioclim) with the two different datasets based on the 30 training-testing subsamples. Circles indicate mean values and bars the 95% bootstrap confidence intervals for 10,000 replicates. Symbols marked by same letter indicate overlapping confidence intervals.

