
Figure 4. Inhibition of glycolysis decreases HNSCC reducing potential, ATP levels and lactate production.
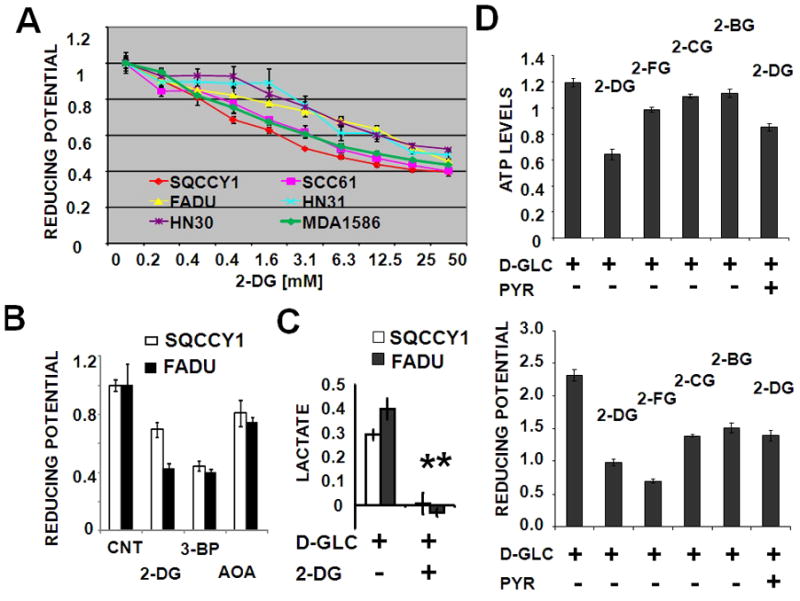
(A) Cells were exposed to increasing concentrations of 2-DG or (B) 2-DG [12.5mM], 3-BP [50μM] and AOA [500μM] in the presence of 5mM D-glucose for 2hr (A), followed by a 2hr MTT reaction. (C) Cells were incubated in D-glucose [1mM] in the presence or absence of 2-DG [10mM] for 6hr followed by measurement of intra-cellular lactate levels (* represents p-value <0.05). (D) Intra-cellular ATP and reducing potential were measured following treatment of cells with 2-DG, 2-FG, 2-CG, 2-BG [25mM] in the presence of D-glucose [10mM] and pyruvate [20mM] for 2hr.