
Figure 6. Inhibition of glycolysis reduces HNSCC proliferation and soft agar growth.
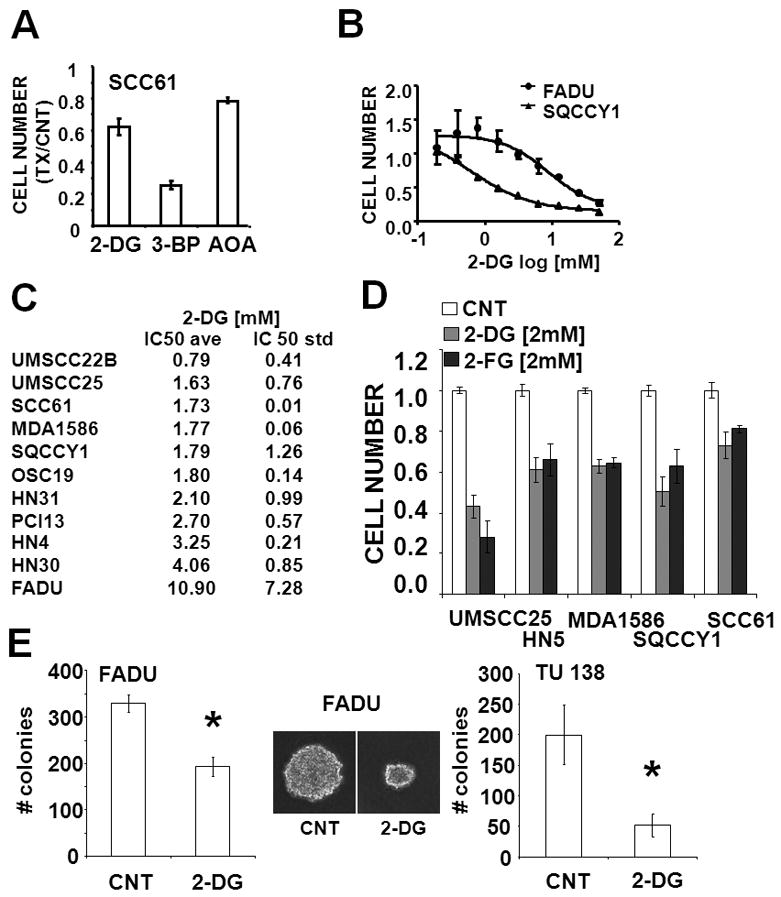
(A) Cells were exposed to 2-DG [12.5mM], 3-BP [62.5μM] and AOA [500μM] for 72hr. Cell number was ascertained and presented relative to the control (media only) condition. (B–D) Following attachment, cells were exposed to increasing concentrations of 2-DG or 2-DG or 2-FG for 72hr. Cell number at the end of the experimental period was ascertained. IC50 values for at least 2 independent experiments were averaged. (E) Cells were seeded in 0.3% soft agar, incubated in either regular media (CNT) or media containing 2-DG [5mM] for 6 days, stained with crystal violet and counted. Representative images are presented in the inset. * represents p-value <0.05.