
Figure 1.
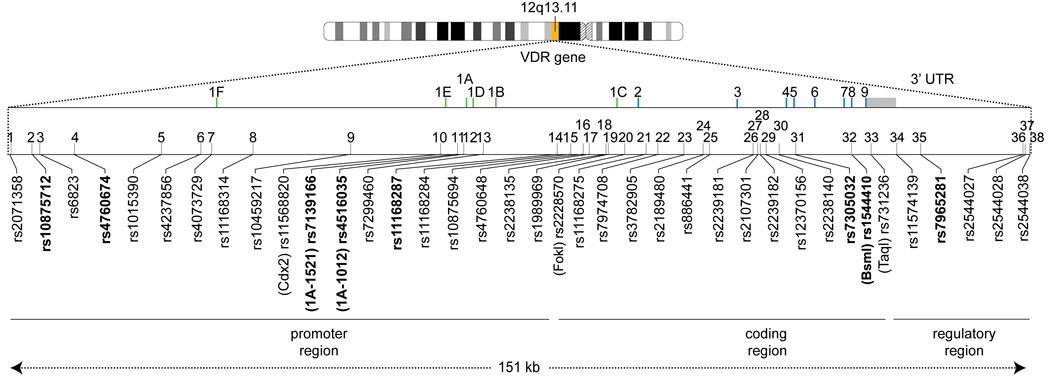
Position of the SNPs studied GEM in relation to the VDR structure. SNPs with significant associations in multivariate analyses after adjusting for age, sex, age-sex interaction, center are shown in bold font. The vertical bars represent promoters 1F – 1C green) and exons (blue). The numbers 1 to 36 refer to the SNP’s relative position from 5’ to 3’ (Table 2). The polymorphism TaqI is located near the stop codon on exon 9, however is strongly linked to the 3’ regulatory region. The grey box represents the 3’ UTR.