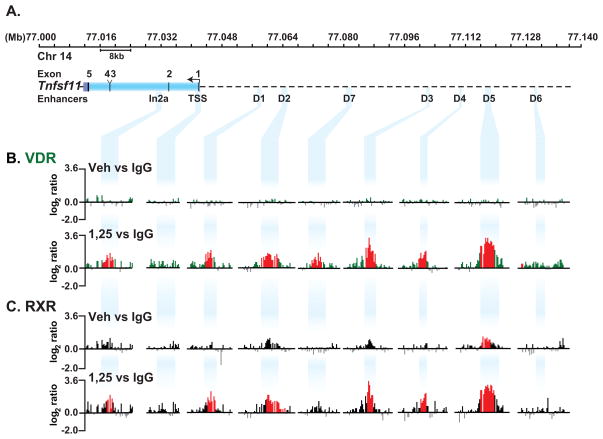
FIGURE 1. ChIP-chip analysis reveals localization of VDR and RXR to the Rankl gene locus in response to 1,25(OH)2D3.
ST2 cells were treated with vehicle or 1,25(OH)2D3 for 6 hours and then subjected to ChIP analysis using antibodies to VDR, RXR or IgG as described in Materials and Methods. A, The upper track depicts the Rankl gene locus. Nucleotide positions (Mb) are shown on chromosome 14 (February 2006 assembly) while the Rankl gene and the positions of the distal enhancer regions are indicated below the chromosomal position and designated by descending blue bands. B, Interaction of VDR with the Rankl gene locus in response to vehicle or 1,25(OH)2D3. Data tracks represent the log2 ratios of fluorescence obtained from 1) a vehicle-treated sample precipitated with antibodies to either VDR or IgG (VDRveh vs IgG) (basal, upper track) and 2) an 1,25(OH)2D3-treated sample precipitated with antibodies to either VDR or IgG (VDR1,25 vs IgG) (total inducible VDR, lower track). Only relevant data segments are shown. C, Interaction of RXR with the Rankl gene locus in response to 1,25(OH)2D3 as described in B. All peaks highlighted in red are statistically significant (FDR<0.05).

