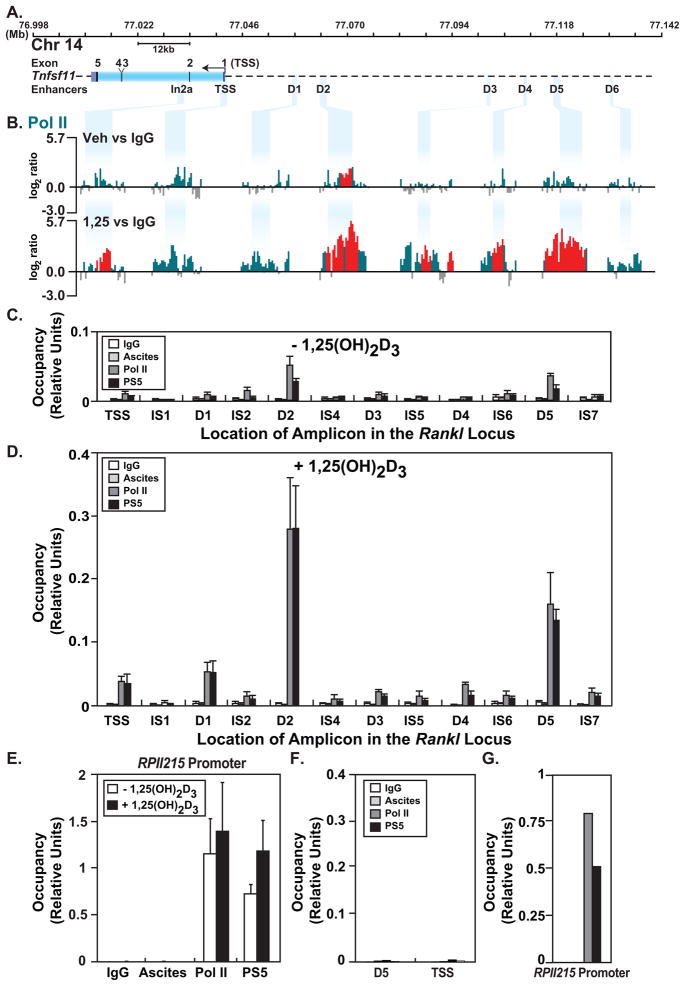
FIGURE 2. ChIP-chip analysis reveals recruitment of S-5 phosphorylated RNA pol II at the Rankl gene locus in response to 1,25(OH)2D3.
ST2 cells were treated as in Fig. 1 and then subjected to ChIP analysis using antibodies to hypo-phosphorylated RNA pol II (pol II), pol II phosphorylated at serine-5 (PS5) or IgG. A, Schematic of the Rankl locus as in Fig. 1A. B, Recruitment of RNA pol II to the Rankl gene locus in response to 1,25(OH)2D3. Data tracks represent the log2 ratios of fluorescence obtained from 1) a vehicle-treated sample precipitated with antibodies to either RNA pol II or IgG (RNA pol IIveh vs IgG) (basal) and 2) an 1,25(OH)2D3-treated sample precipitated with antibodies to either RNA pol II or IgG (RNA pol II1,25 vs IgG) (total inducible). Only relevant data segments are shown. All peaks highlighted in red are statistically significant (FDR<0.05). C, ST2 cells were treated with vehicle or D, 10−7 M 1,25(OH)2D3 for 6 hr and then subjected to direct ChIP assay using antibodies to hypo-phosphorylated RNA pol II (pol II) or serine-5 phosphorylated (PS5) RNA pol II. Class-specific IgGs were used as controls (RNA pol II, IgG; PS5, ascites). Precipitated DNA was analyzed by q-PCR and the products quantitated using a standard curve consisting of dilutions of the corresponding input DNA. E, qPCR analysis of RNA pol II and PS5 recruitment to the RPII215 promoter in untreated and 1,25(OH)2D3-treated ST2 cells. F and G, qPCR analysis of RNA pol II and PS5 recruitment to the mRLD5 and TSS regions of the Rankl locus or to the RPII215 promoter in control RAW264.7 macrophage cells, respectively. All results represent the average of three independent experiments ± SD.

