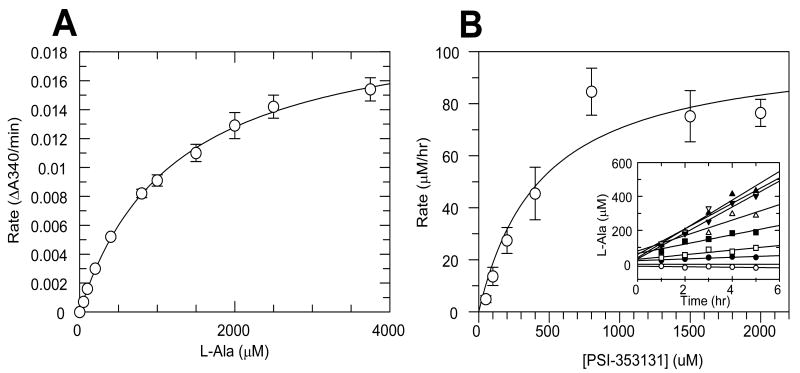
Figure 6. Hint1 activity assay.
A standard curve for L-alanine dehydrogenase (L-AlaDH) was generated by plotting the initial rates against the L-Ala concentrations (A). L-Ala formation was monitored for Hint1-mediated deamination of PSI-353131 (B). Rates were calculated from the individual time courses (inset). Bars in the graphs represent the standard error of the linear regression analysis from the individual time courses.

