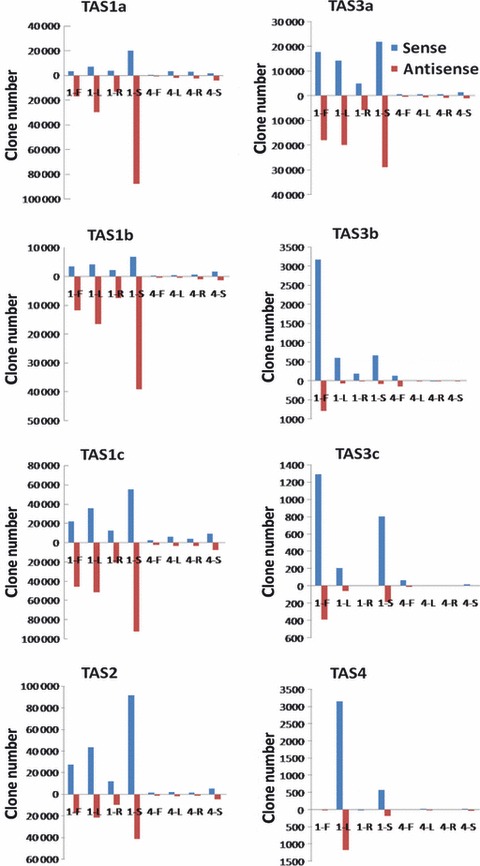
Figure 7.

Phased small non-coding RNA (smRNA) clusters on TAS1-4 genes. Bar charts present total clone numbers of phased smRNAs on the plus strand (blue bars) and minus strand (red bars) of known TAS genes in each sample. ‘1’ and ‘4’ represent AGO1 and AGO4, respectively. F, flowers; L, leaves; R, roots; S, seedlings.
