
Figure 2.
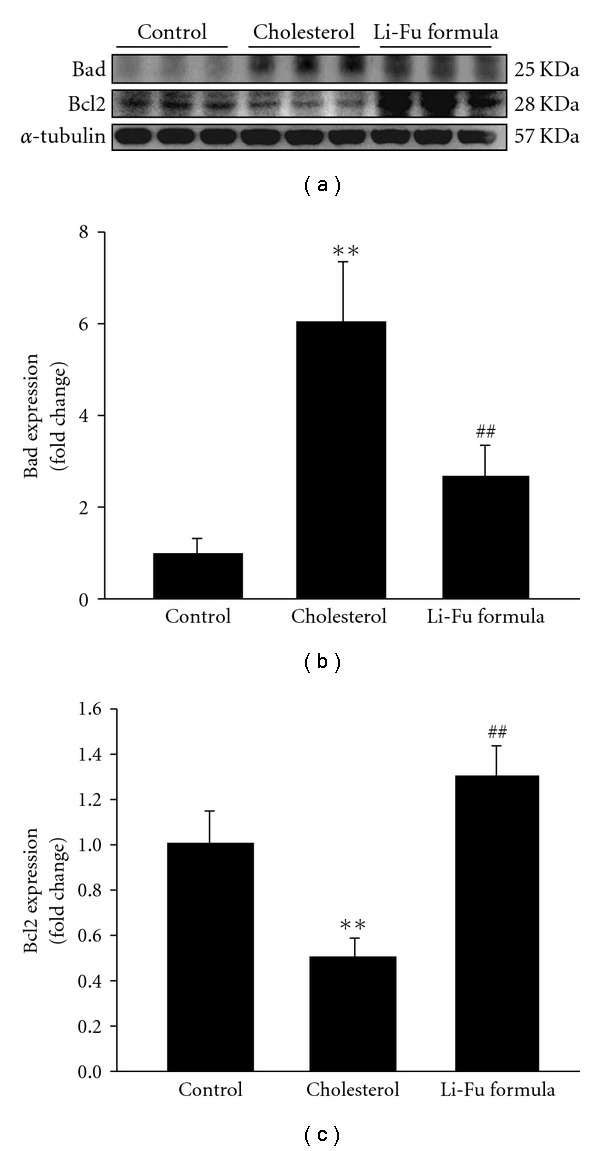
(a) The representative protein products of Bad and Bcl-2 extracted from the left ventricles of excised hearts in hamsters of Control, Cholesterol and Li-Fu formula groups were measured by western blotting analysis. ((b) and (c)) Bars represent the relative protein quantification of Bad and Bcl-2 on the basis of α-tubulin. All bars indicate mean values ± SD (n = 6 in each group). **P < .01, significant differences between Control and Cholesterol group. ## P < .01, significant differences between Cholesterol and Li-Fu formula groups.