
Figure 3.
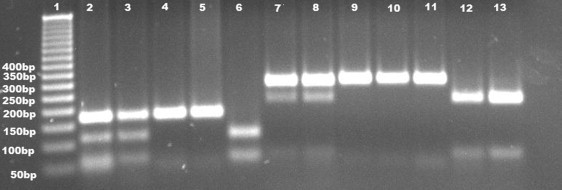
Restriction Fragment Length Polymorphism Analysis Visualized with Ethidium-Bromide Staining after Agarose Gel Electrophoresis
Lane 1 shows size marker with corresponding bands as base pairs. Lanes 2–5 show BsrI digestion in Family A with fragments of 182 bp for the mutated allele, and 116 and 66 bp, respectively, for the normal allele. Lanes 2 and 3 show heterozygous parents (III-1 and III-2, respectively, in Figure 1). Lanes 4 and 5 belong to affected siblings (IV-1 and IV2, respectively, in Figure 1A). Healthy control (as shown in lane 6) shows 2 bands (116 and 66 bp, respectively). Lanes 7-13 show HphI digestion in Family B with fragments of 294 bp for the mutated allele and 214 and 66 bp, respectively, for the normal allele. Lanes 7 and 8 depict heterozygous parents (III-1 and III-2, respectively, in Figure 2A) with three bands (294, 214, and 66 bp). Homozygous siblings (IV-1, IV-2, and IV-3 in Figure 2A), as shown in lanes 9, 10, and 11, give one band with 294 bp. Lanes 12 and 13 correspond to a healthy sibling (IV-4 in Figure 2A) and a healthy control, respectively, and are associated with two bands of 214 and 66 bp.