
Figure 7.
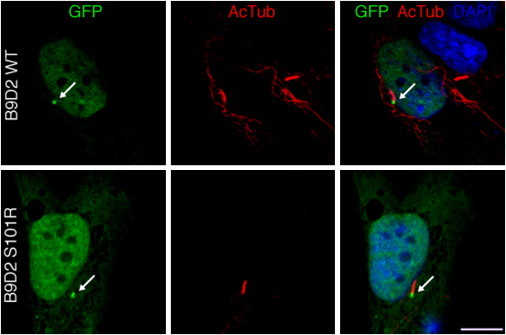
Localization of Wild-Type B9D2 and B9D2 S101R
hTERT-RPE1 cells expressing GFP-tagged wild-type B9D2 or B9D2 S101R (green). Expressions of both are enriched at the base of cilia (AcTub, red, arrows). Nuclei are visualized with DAPI (blue). Scale bar represents 10 μm.