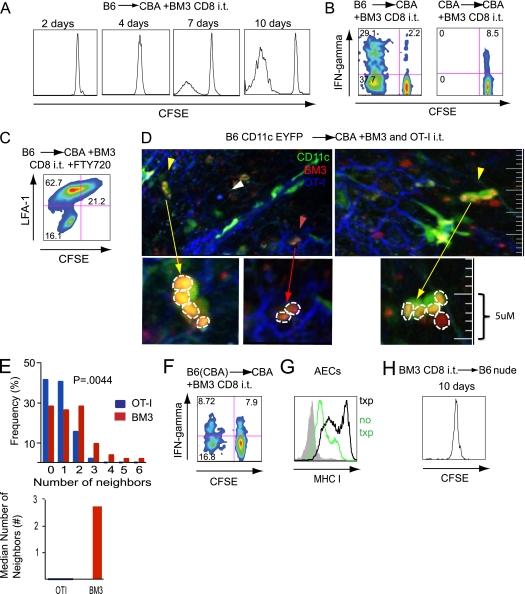
Figure 2.
Intratracheal CD8+ T cell administration. (A) Representative proliferative profiles of BM3 CD8+ T cells 2, 4, 7, and 10 days (n = 3) after intratracheal administration into CBA/Ca recipients of B6 lung grafts. (B) Proliferation and IFN-γ production by BM3 T cells delivered intratracheally into B6 (left panel) or CBA (right panel) grafts. (C) Representative plot demonstrating proliferation and lymphocyte function-associated antigen 1 (LFA-1) down-regulation in BM3 CD8+ T cells 10 days after intratracheal adoptive transfer into FTY-720 treated CBA/Ca recipient of a B6 lung graft (n = 4). (D) Two separate sections demonstrating two-photon imaging of the alveolar space of B6 CD11c-EYFP+→CBA/Ca graft showing BM3 T cells (5-(and-6)-([(4-chloromethyl)benzoyl]amino)tetramethylrhodamine [CMTMR], red), OT-I T cells (7-amino-4-chloromethylcoumarin [CMAC], blue), CD11c-EYFP+ cells (green), and collagen fibers (second harmonic signal, blue) (left graph). The yellow arrows point to multiple red BM3 T cells clustering around a green CD11c+ alveolar macrophage. Red T cells directly overlying a green macrophage appear yellow. Red arrow points to two BM3 T cells clustering within the airway next to airway epithelial cells (AECs), as seen by the blue second harmonic signal of supporting collagen fibers in the alveolar space. White arrowhead points to a solitary OT-I T cell in the alveolar space. The row below represents higher magnification of clustering with individual BM3 T cells outlined by white dashed lines. (E) Neighboring distribution analysis (top graph) was performed on 21 representative z-stacks from two independent experiments evaluating clustering of BM3 (red bars) and OT-I (blue bars) T cells. The median number of neighbors was 0 for OT-I and 2.75 for BM3 T cells (bottom graph). The analysis is based on evaluation of 103 OT-I and 91 BM3 T cells. (F) Proliferation and IFN-γ production by BM3 CD8+ T cells after intratracheal administration into CBA/Ca recipients of B6(CBA) lung grafts (n = 6). (G) Major histocompatibility (MHC) class I expression on AECs in untransplanted B6 control mice (green) or transplanted lungs (black) (n = 6). (H) Proliferation of BM3 CD8+ T cells 10 days after intratracheal administration into B6 nude recipients (n = 5).

