Figure 5.
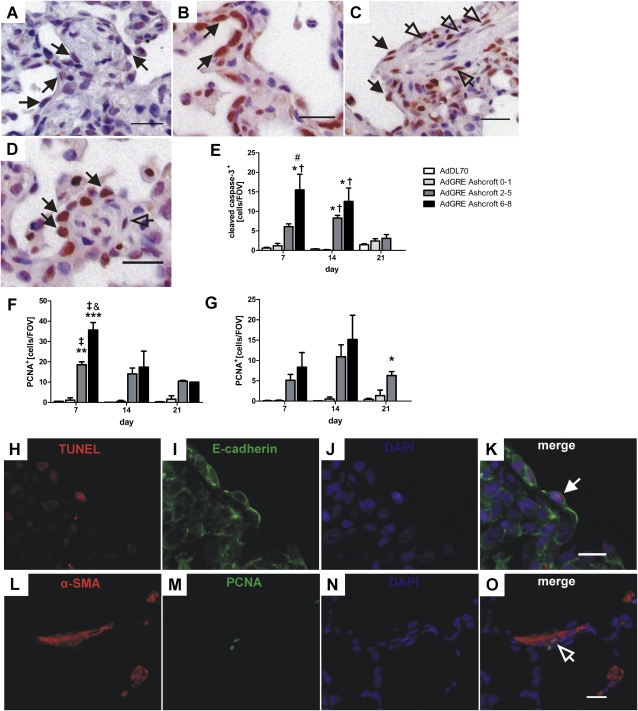
Apoptosis and proliferation in AdGRE. (A) IHC for cleaved caspase-3, demonstrating representative apoptotic epithelial cells (black arrows) in AdGRE rat lung at Day 14. (B–D) IHC for proliferating cell nuclear antigen (PCNA), demonstrating representative proliferating epithelial cells (black arrows) at Day 7 (B) and 14 (C and D) and representative proliferating fibroblasts (arrows) at Day 14 (C and D). Counterstaining with Mayer's hematoxylin. Original magnification, 400× (A–D); scale bar, 20 μm (A–D). (E–G) Quantification of cleaved caspase-3+ epithelial cells (E), PCNA+ epithelial cells (F), and PCNA+ fibroblasts (G), according to degree of interstitial damage in AdGRE-treated animals as compared with AdDL70 rats. Each bar represents the mean (±SEM) of two to three animals per group. *P < 0.05, **P < 0.01, ***P < 0.0001, all versus AdDL70; †P < 0.05, ‡P < 0.01, both versus AdGRE Ashcroft 0–1; #P < 0.05, and P < 0.01, both versus AdGRE Ashcroft 2–5. (H–K) Double immunofluorescence for E-cadherin (green) and terminal deoxynucleotidyl transferase dUTP nick end labeling (TUNEL; red), indicating a representative apoptotic epithelial cell (white arrow) in AdGRE rat lung at Day 7. (L–O) Double immunofluorescence for α-SMA (red) and PCNA (green) to demonstrate a proliferating myofibroblast (arrow). Nuclear counterstaining with 4′-6′-diamidino-2-phenylindole (DAPI (H–O). Original magnification, 400× (H–O); scale bar, 10 μm (K and O).

