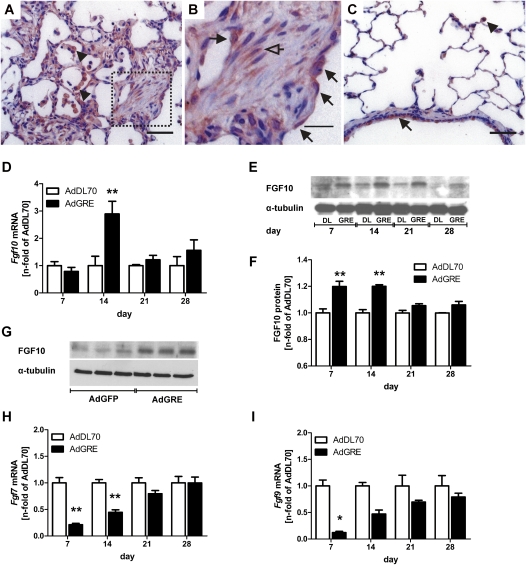
Figure 6.
Expression of fibroblast growth factor (FGF)–7, FGF9 and FGF10 in AdGRE. A–C: Representative FGF10 IHC in AdGRE animal at Day 14 (A and B) compared with AdDL70 Day 14 (C). (B) Boxed area from (A) enlarged. Expression is found in epithelial cells (black arrows), fibroblasts (arrows) and alveolar macrophages (arrowheads) in AdGRE lungs, and in epithelial cells (black arrows) and alveolar macrophages (arrowheads) in AdDL70 lungs. (D) Fgf10 mRNA expression in lung homogenate of AdGRE-treated rats as compared with AdDL70 animals. Each column represents the mean (±SEM) of four to six animals per group. **P < 0.01 versus AdDL70. (E) Representative Western blot of FGF10 protein expression in AdGRE- and AdDL70-treated rats. α-Tubulin was used to ensure equal loading. (F) Densitometric quantification of FGF10 protein content in AdGRE versus AdDL70 rats. Each bar represents the mean (±SEM) of n fold of AdDL70, two to five animals per group. **P < 0.01 versus AdDL70. (G) Representative Western blot of FGF10 protein expression in A549 cell transfected with AdGRE or AdGFP. α-tubulin was used to ensure equal loading. (H and I) Fgf7 (H) and Fgf9 (I) mRNA expression in lung homogenate of AdGRE-treated rats compared with AdDL70 animals. Each column represents the mean (±SEM) of four to six animals per group. *P < 0.05, **P < 0.01 versus AdDL70.

