
Figure 4.
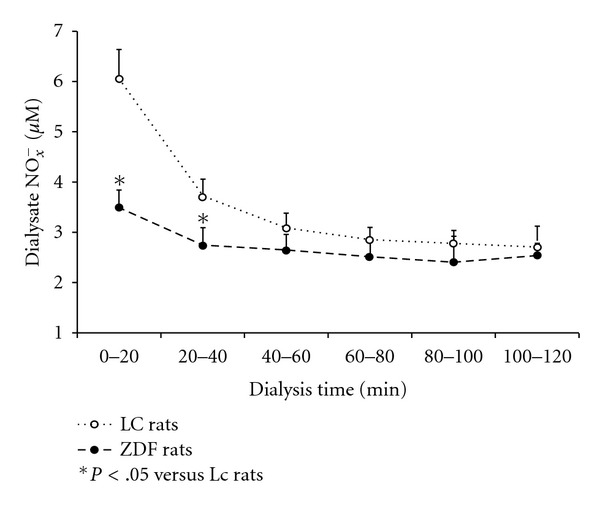
The time intervals of dialysate nitrite plus nitrate (NOx −) concentrations in the GN in ZDF rats versus LC rats. Dialysate NOx − from perfusion periods was analyzed as follows: 0–20, 20–40, 40–60, 60–80, 80–100 and 100–120 min. Each point represents mean ± SEM (n = 10). *P < .05 versus LC rats. There was a significant difference of the dialysate NOx − concentrations between ZDF rats and LC rats in 0–20 and 20–40 min (P < .05).