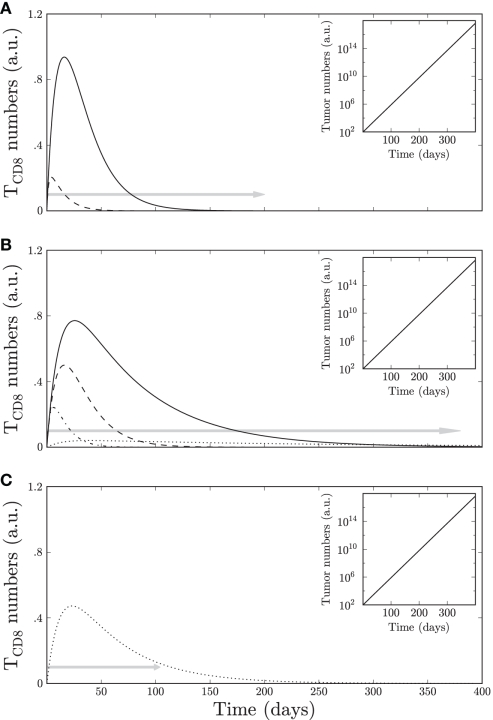
Figure 6.
Simulated TCD8s response in (A) pancreatic tumors, (B) osteosarcomas, and (C) brain tumors. Y-axis depicts the number of TCD8s in arbitrary units and x-axis depicts the time in days. Site I-specific TCD8s is shown with a dashed line, TII/III with a dash-dot line, site IV-specific TCD8s with a solid line, and TV with a dot line. Light gray arrows show the average lifespan of mice. All cases show a sequential loss of TCD8 cells against different sites. The insets indicate tumor growth.

