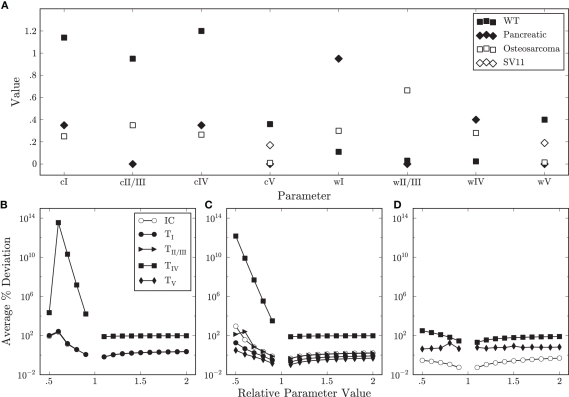
Figure A3.
(A) The values of the parameters that were varied in different cases are shown on the x-axis for the wild-type (black squares), pancreatic tumor (black diamonds), osteosarcoma (white squares), and brain tumor (white diamonds) models. nI fixes the value of nIV( = 4nI) and nV ( = 0.3nI), and are not shown. (B–D) The effect of varying the wIV parameters by a multiplicative factor (x-axes) on the variables is shown as an average percent deviation (APD) in the pancreatic, osteosarcoma, and wild-type cases (y-axes). Very small APDs (<10−9) are not shown.

