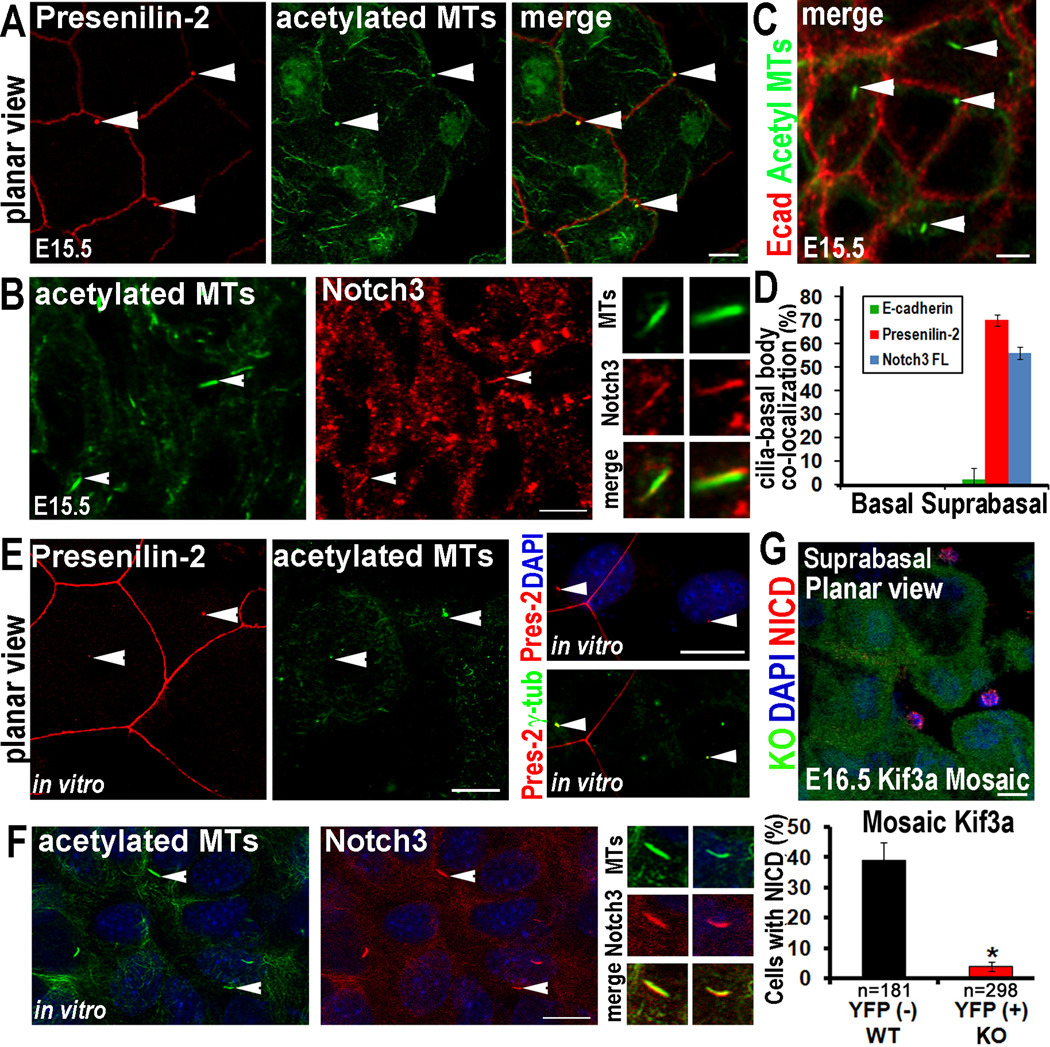
Figure 7. Notch signaling components are enriched at primary cilia in suprabasal epidermal cells.
(A) Whole mount immunolocalization of Presenilin-2 (red) at basal body/ciliary structures (green) in suprabasal cells of developing E15.5 epidermis. (B) Whole mount of suprabasal E15.5 epidermis shows enriched Notch3 receptor immunolocalization at a subset of acetylated tubulin+ cilia (arrows), shown magnified in right panels. Neither Presenilin-2 nor Notch3 receptor were detected in the basal bodies/cilia in basal layer confocal planes. (C) Whole mount of suprabasal E15.5 epidermis shows lack of E-cadherin labeling (red) at cilia (green; arrows). (D) Quantification of % cilia with E-cadherin, Presenilin2 or Notch3 colocalization in basal and suprabasal confocal planes of E15.5 epidermis. n≥100 cells/condition. Data are represented as mean +/− SEM. (E) In vitro localization of Presenilin-2 at basal body/ciliary structures and in vitro co-localization of Presenilin-2 and the basal body/centrosome marker γ-tubulin. (F) In vitro localization of Notch3 at cilia in differentiating MKs. Arrows point to individual cilia shown magnified in the panels at right. (G) E16.5 mosaic skin from Kif3a cKO epidermis. Note WT cells (YFP−) showing NICD3 nuclear accumulation (red), while adjacent Kif3a null cells (YFP+) lack nuclear NICD3. Quantification of NICD(+) Kif3a cKO vs WT cells, where 200–300 cells from 2–3 embryos were quantified/per condition. Data are represented as mean +/− SEM. Scale bars=10 µM. See also Figure S7.

