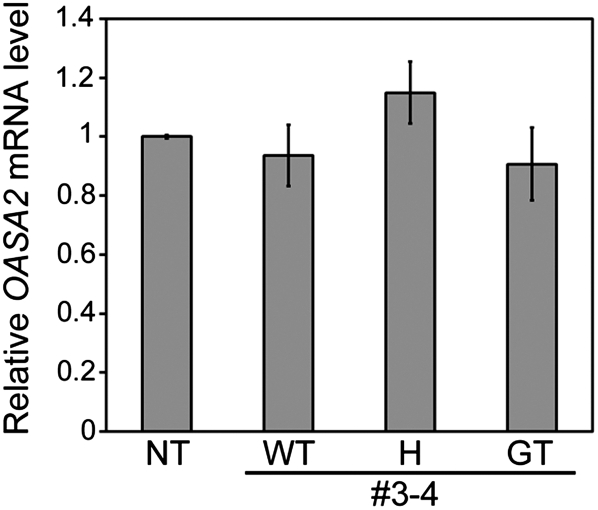
Figure 6.
OASA2 expression level in number 3-4 quantitative RT-PCR of OASA2 in leaves of nontransformant (NT), wild type (WT), and homozygous (GT) and heterozygous (H) for the modified OASA2. OASA2 mRNA levels were normalized to the OsActin1 mRNA level as a control and are presented as a ratio of that observed in NT. Values are average ± sd (n = 3).

